New to Telerik UI for ASP.NET AJAX? Start a free 30-day trial
Set Gradient Color to PlotArea
Updated on Feb 27, 2026
This help article shows how to set a gradient color to the PlotArea of the ASP.NET AJAX Chart.
Generally, the PlotArea of the RadHtmlChart doesn't provide gradient colors. You can, however, use the Kendo Drawing API in order to draw gradient colors over the PlotArea once the chart is rendered. You can see the code that creates Figure 1 in Example 1.
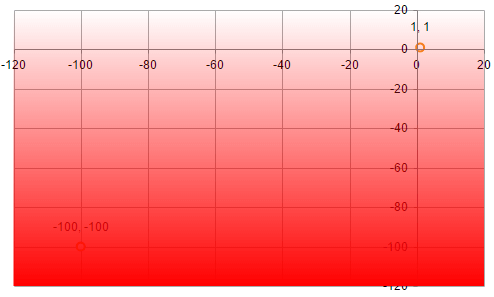
Figure 1: A chart that has a gradient color to its PlotArea.
Example 1: Draw a gradient over the chart's PlotArea via the Kendo UI Drawing API.
JavaScript
function chartLoad(chart) {
	var chart = chart.get_kendoWidget();
	var kendo = $telerik._kendo;
	var draw = kendo.drawing;
	var geom = kendo.geometry;

	var gradient = new draw.LinearGradient({
		start: [0, 0], // Bottom left
		end: [0, 1],   // Top left
		stops: [{
			offset: 0,
			color: "#f00",
			opacity: 0
		}, {
			offset: 1,
			color: "#f00",
			opacity: 1
		}]
	});

	var xAxis = chart.getAxis("xAxis");
	var yAxis = chart.getAxis("yAxis");
	var xSlot = xAxis.slot(xAxis.range().min, xAxis.range().max);
	var ySlot = yAxis.slot(yAxis.range().min, yAxis.range().max);

	var rect = new geom.Rect([
		// Origin X, Y
		xSlot.origin.x, ySlot.origin.y
	], [
		// Width, height
		xSlot.width(), ySlot.height()
	]);

	var path = draw.Path.fromRect(rect, {
		stroke: null,
		fill: gradient
	});
	setTimeout(function () {
		chart.surface.draw(path);
	}, 10);
}