Data Binding Overview
This help article describes the required data structure for the ASP.NET AJAX Chart. It explains how to use fields (columns) and rows.
A data bound series in RadHtmlChart expects a field (column) name and will take the data from all records (rows) in the provided data source. Table 1 shows a supported data source structure and Table 2 shows an unsuitable data source structure. You can see a sample implementation of a good data source in Example 1.
Table 1: Expected structure of the RadHtmlChart data source
| X_Axis_Labels | First_Series_Values | Second_Series_Values |
|---|---|---|
| Label 1 | 1 | 5 |
| Label 2 | 10 | 15 |
| Label 3 | 20 | 25 |
If your data source looks like Table 2, review the Group RadHtmlChart Data Source article. Alternatively, you can traverse your data source and create series items programmatically.
Table 2: Unsupported data source structure for RadHtmlChart
| X_Axis_Labels | series_group_name | value |
|---|---|---|
| Label 1 | first | 1 |
| Label 2 | first | 10 |
| Label 3 | first | 20 |
| Label 1 | second | 5 |
| Label 2 | second | 15 |
| Label 3 | second | 25 |
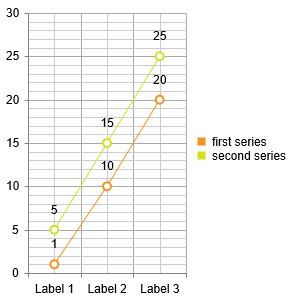
Example 1: Sample implementation of the supported data source for RadHtmlChart from Table 1. You can see the result in Figure 1.
<telerik:RadHtmlChart runat="server" ID="RadHtmlChart1" Width="300px" Height="300px">
	<PlotArea>
		<Series>
			<telerik:LineSeries DataFieldY="First_Series_Values" Name="first series"></telerik:LineSeries>
			<telerik:LineSeries DataFieldY="Second_Series_Values" Name="second series"></telerik:LineSeries>
		</Series>
		<XAxis DataLabelsField="X_Axis_Categories"></XAxis>
	</PlotArea>
</telerik:RadHtmlChart>protected DataTable GetChartData()
{
DataTable tbl = new DataTable();
tbl.Columns.Add(new DataColumn("X_Axis_Categories", typeof(string)));
tbl.Columns.Add(new DataColumn("First_Series_Values", typeof(decimal)));
tbl.Columns.Add(new DataColumn("Second_Series_Values", typeof(decimal)));
tbl.Rows.Add(new object[] {"Label 1", 1, 5 });
tbl.Rows.Add(new object[] {"Label 2", 10, 15 });
tbl.Rows.Add(new object[] {"Label 3", 20, 25 });
return tbl;
}
protected void Page_Load(object sender, EventArgs e)
{
if (!Page.IsPostBack)
{
RadHtmlChart1.DataSource = GetChartData();
RadHtmlChart1.DataBind();
}
}Figure 1: The result from Example 1 - correct series data binding.