
Telerik Reporting
What's New R3 2023
What's New HistorySkiaSharp-based Graphics Library for Linux
SkiaSharp, a powerful 2D graphics library, has become a cornerstone for advancing the capabilities of .NET 6 and beyond by facilitating the deployment of applications on Linux environments. This integration utilizes the cross-platform potential of .NET, providing developers with a seamless solution for Linux deployment. The incorporation of an embedded Web Report Viewer enhances the user experience, allowing for dynamic and interactive data visualization. Furthermore, the inclusion of PDF export functionality adds a layer of versatility, enabling users to effortlessly generate and share comprehensive reports in the most requested format. Support for the rest of the export formats will follow in the next product update.
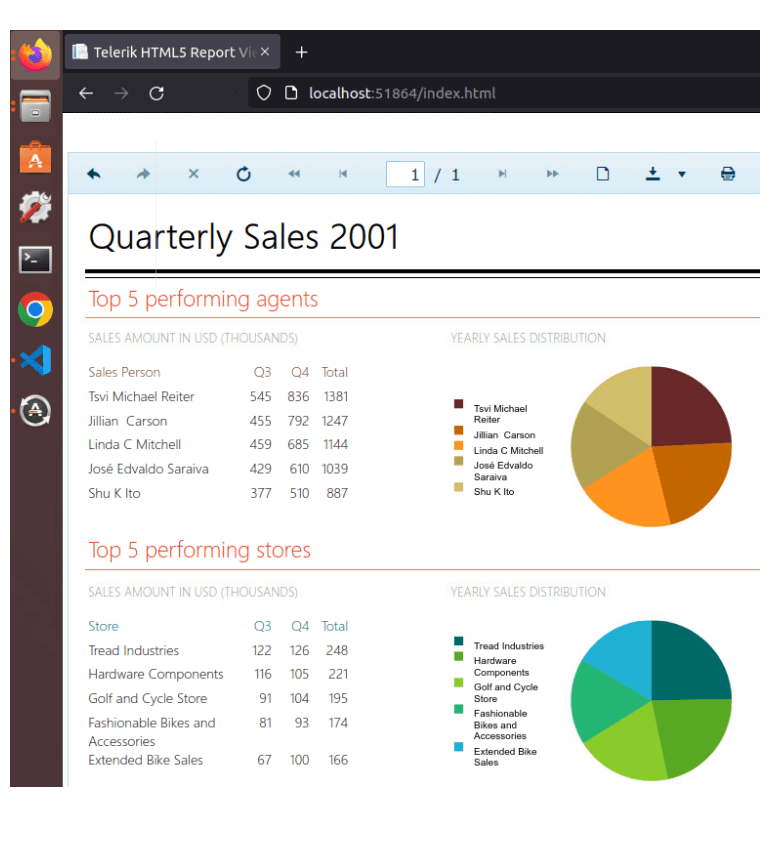
Native Angular Report Viewer
Report authors now will be able to seamlessly implement report preview functionality using a native Angular report viewer control, so that the end-users get the best possible UX from perfectly blending UI controls when using Kendo UI for Angular and Telerik Reporting into an application. Leveraging the power of Angular, this viewer provides a responsive and dynamic reporting interface, ensuring an optimal user experience across various devices. Note that embedding the new native Angular viewer requires a valid Kendo UI for Angular or DevCraft license.

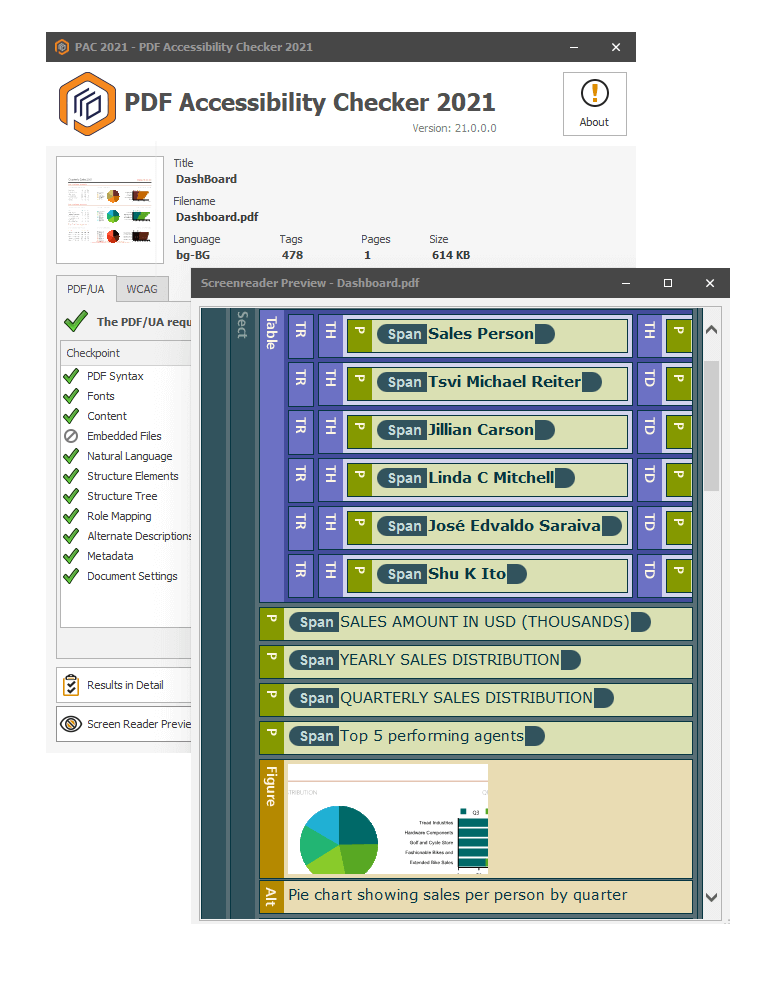
PDF Accessibility vNext
We enhanced our PDF export engine and now allow report authors to generate accessible PDF documents from apps that rely on the Telerik Embedded Reporting tool. We improved the structure elements and structure tree generation of the generated document. What that means is that each text span, image and drawing in the document belongs to a semantic tree so that assistive technologies such as screen readers recognize it and allow better navigation among the information. This means produced documents now meet the requirements of the PDF/A-1a (“a” for accessibility) standard.
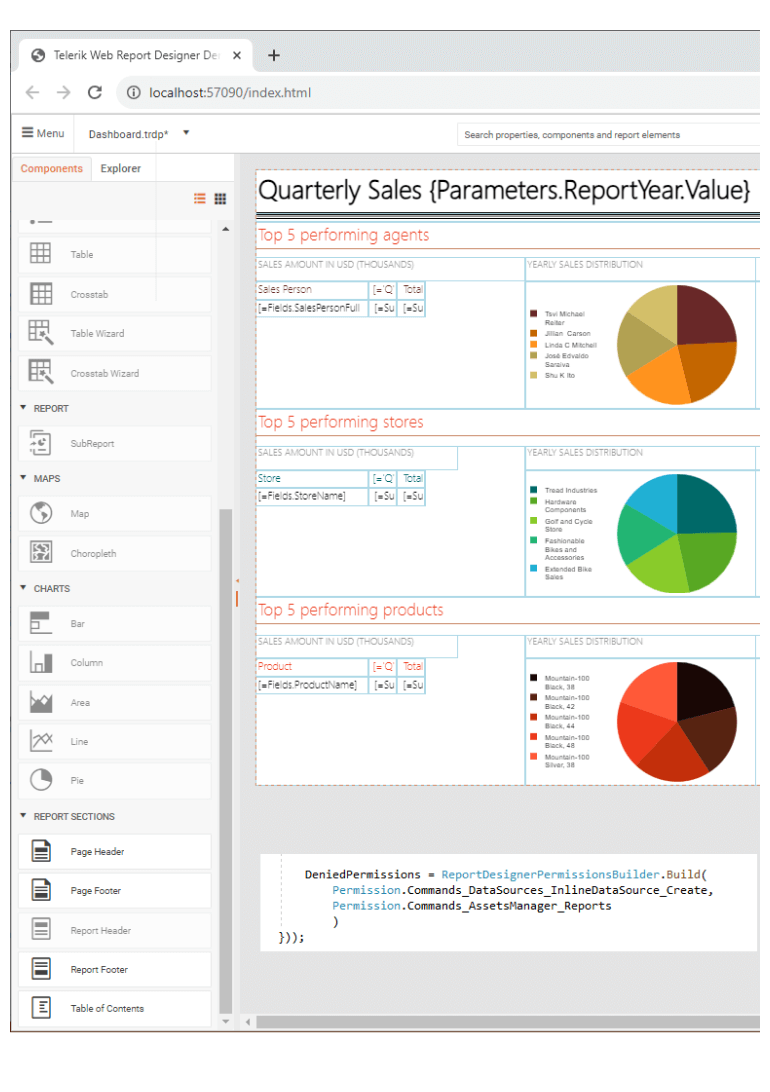
Implement APIs for Web Report Designer Customization
The Web Report Designer in Telerik Reporting gains flexibility in its built-in capabilities by allowing customization of appearance and enabled functionality using extended APIs. These enable developers to restrict the designer usage in multiple ways, including:
- Hide main menu items (e.g., hide opening another report, prevent override)
- Hide particular Toolbox items like some or all of the data source components
- Restrict the usage of the Assets Manager
Additional notification API allows subscribing to designer messages and eventual errors.
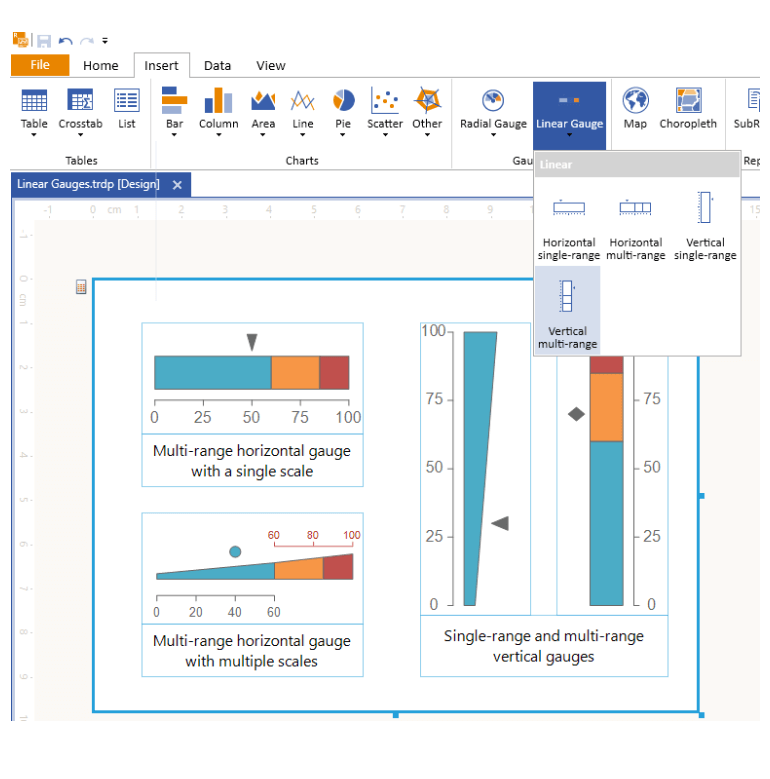
Introduce Linear Gauge Item
Report authors can now seamlessly visualize KPI data by using the new Linear Gauge. The Linear Gauge Item is a versatile and visually engaging component that finds application in data visualization, particularly in contexts where conveying measurements, progress, or metrics is crucial. This dynamic element is adept at presenting information along a linear scale, offering an intuitive and precise representation of values. Additionally, the Radial Gauge Item that we introduced in R2 2023 received an update so that all the scalar properties of the model represent units relative to the item's size. This way the item’s content resizes gradually when its bounds are changed.
Gauge Report Item Wizard Pane in Web Report Designer
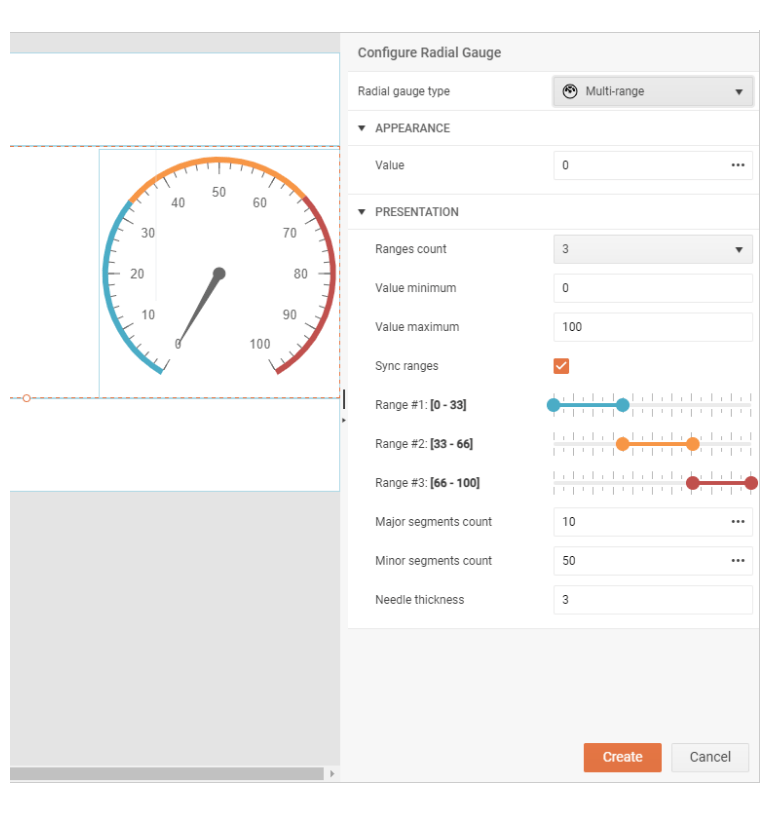
The Gauge Report Item Wizard pane in the Web Report Designer is a user-friendly interface that empowers report authors to effortlessly incorporate dynamic and visually striking gauge elements into their reports. The Gauge Report Item Wizard pane streamlines the design process, enabling even those with minimal coding expertise to craft compelling and informative reports, enhancing the overall data visualization capabilities of the Web Report Designer.
Add Align Support to the Image into a PictureBox Item
The addition of align support to the image within a PictureBox Item represents a significant enhancement in visual design and layout flexibility. This feature allows report authors to precisely control the alignment of images like logos within the PictureBox, ensuring that the visual presentation meets specific report design requirements.

Expose the Report Parameters Values for All HTML5-based Report Viewers
By exposing report parameters, report authors gain the ability to dynamically adjust and fine-tune the content of reports, tailoring them to specific end-users' needs. When you embed reporting into the HTML-5-based report viewer, this newly introduced API will enable you to access the values of the report parameters easily and execute custom app logic using them.
Replace VML with DrawingML in OpenXML Rendering Extensions
PictureBox item now outputs DrawingML (Drawing Markup Language) content instead of VML (Vector Markup Language) in OpenXML Rendering Extensions. With this enhancement, OpenXML Rendering Extensions offer enhanced support for complex graphics, improved fidelity, and broader compatibility with modern document standards.
Telerik Reporting - R3 2023
- SkiaSharp-based Graphics Library for Linux
- Native Angular Report Viewer
- PDF Accessibility vNext
- Implement APIs for Web Report Designer Customization
- Introduce Linear Gauge Item
- Gauge Report Item Wizard Pane in Web Report Designer
- Add Align Support to the Image into a PictureBox Item
- Expose the Report Parameters Values for All HTML5-based Report Viewers
- Replace VML with DrawingML in OpenXML Rendering Extensions
New features & Roadmap
Have a feature request?
Post your feedback via the Reporting feedback portal or the public forums
What's new across all Telerik products?
See the updates feed

Next Steps
See Telerik’s Report Designer in action and check how much it can do out of the box
Check out the offers. Purchase an individual license for .NET reporting or treat yourself to one of our bundles.
Try Telerik’s .NET Reporting tool with dedicated technical support.
