
How to Use Kendo UI for Angular to Display and Manage Data from Your Python App

Angular is a great choice for data management and display within your Python app. Take it a step further with Kendo UI for Angular.
As a Python developer, you often deal with data and need efficient ways to visualize and manage it. The Angular UI framework has emerged as a great choice for a rich and easy development experience. Read more about why in “How to Use Angular to Create Next-Level UI for Python Apps (and Why Do It).”
Many developers extend these gains with component libraries such as the popular Kendo UI for Angular. In this tutorial, we’ll explore how to use Kendo UI for Angular to create a data view that showcases advanced features such as grids and charts. By the end, you’ll have a solid understanding of how to consume, manage and display data using Kendo UI for Angular in your Python applications.
Making a Grid
In this example, we will explore how to create a grid using Progress Kendo UI for Angular, a popular UI component library. Kendo UI for Angular offers a comprehensive set of tools and components designed specifically for Angular applications. With its extensive feature set and customizable options, Kendo UI for Angular provides developers with a seamless way to create dynamic and interactive grids.
We will start by setting up a new Angular project and integrating Kendo UI for Angular. Then we will create a sample dataset and configure the grid to display and manage the data effectively.
Prerequisites
Before we dive into the tutorial, make sure you have the following prerequisites installed:
- Python (3.x or above)
- Angular CLI
- Kendo UI for Angular
Kendo UI Trial License
Kendo UI and full access to its professional support are completely free for 30 days. All you need to do is follow a few easy steps to get a trial license. To activate your trial or commercial license for Kendo UI for Angular, follow these steps:
- Visit the Telerik website: Go to the Telerik website and navigate to the Kendo UI for Angular product page.
- Get a Trial or Purchase a License: If you don’t have a license yet, you can start a free trial by clicking on the “Start Free Trial” button. If you already have a license, click on the “Buy Now” button to purchase a commercial license.
- Select the License Type: Choose the license type that best suits your needs, whether it’s an individual license, a team license, or an enterprise license.
- Fill out the License Request Form: Fill out the license request form with the required information, including your name, email address, company name, and any additional details requested.
- Submit the License Request: Once you have filled out the form, submit it to Telerik for processing.
- Receive License Information: After submitting the license request, you will receive an email containing your license information, including a license key or a trial activation link.
- Apply the License in Your Project:
○ Trial License: If you received a trial activation link, follow the provided instructions to activate the trial license. This will typically involve accessing a specific URL or running a command in your project directory.
○ Commercial License: If you received a license key, follow these steps to apply it in your project:
■ Open the src/styles.scss file in your Angular project.
■ Add the following import statement at the top of the file:
@import "~@progress/kendo-theme-default/scss/all";
- Replace kendo-theme-default with the name of the theme you want to use if you’re not using the default theme.
- Open the src/app/app.module.ts file.
Import the Kendo UI for Angular modules you want to use. For example, if you want to use the Grid and Button modules, add the following import statements:
import { GridModule } from '@progress/kendo-angular-grid';
import { ButtonsModule } from '@progress/kendo-angular-buttons';
In the @NgModule decorator’s imports array, add the imported modules:
imports: [
  // Other imported modules
  GridModule,
  ButtonsModule
]
To verify that your license has been successfully activated, open your application in the browser. If your development server is running, restart it to ensure the changes take effect. The Kendo UI for Angular components should now be functioning without any trial-related limitations.
Step 1: Setting up the Python API
First, let’s set up a Python-based stats API to provide us with the necessary data. Follow these steps:
- Create a new directory for your Python API and navigate into it.
- Set up a virtual environment to keep dependencies isolated:
python -m venv env
Activate the virtual environment:
For Windows:
env\Scripts\activate
For macOS/Linux:
source env/bin/activate
Now, install Flask, using pip:
pip install flask
Now, create a new Python file, api.py, and add the following code to set up a basic Flask API:
Python
from flask import Flask, jsonify

app = Flask(__name__)

@app.route('/api/stats')
def get_stats():
	# Sample data for demonstration
	stats = [
  {
	"userId": 1,
	"id": 1,
	"title": "sunt aut facere repellat provident occaecati excepturi optio reprehenderit",
	"body": "quia et suscipit\nsuscipit recusandae consequuntur expedita et cum\nreprehenderit molestiae ut ut quas totam\nnostrum rerum est autem sunt rem eveniet architecto"
  },
  {
	"userId": 1,
	"id": 2,
	"title": "qui est esse",
	"body": "est rerum tempore vitae\nsequi sint nihil reprehenderit dolor beatae ea dolores neque\nfugiat blanditiis voluptate porro vel nihil molestiae ut reiciendis\nqui aperiam non debitis possimus qui neque nisi nulla"
  },
  {
	"userId": 1,
	"id": 3,
	"title": "ea molestias quasi exercitationem repellat qui ipsa sit aut",
	"body": "et iusto sed quo iure\nvoluptatem occaecati omnis eligendi aut ad\nvoluptatem doloribus vel accusantium quis pariatur\nmolestiae porro eius odio et labore et velit aut"
  },
  {
	"userId": 1,
	"id": 4,
	"title": "eum et est occaecati",
	"body": "ullam et saepe reiciendis voluptatem adipisci\nsit amet autem assumenda provident rerum culpa\nquis hic commodi nesciunt rem tenetur doloremque ipsam iure\nquis sunt voluptatem rerum illo velit"
  },
	]
	return jsonify(stats)

if __name__ == '__main__':
	app.run()
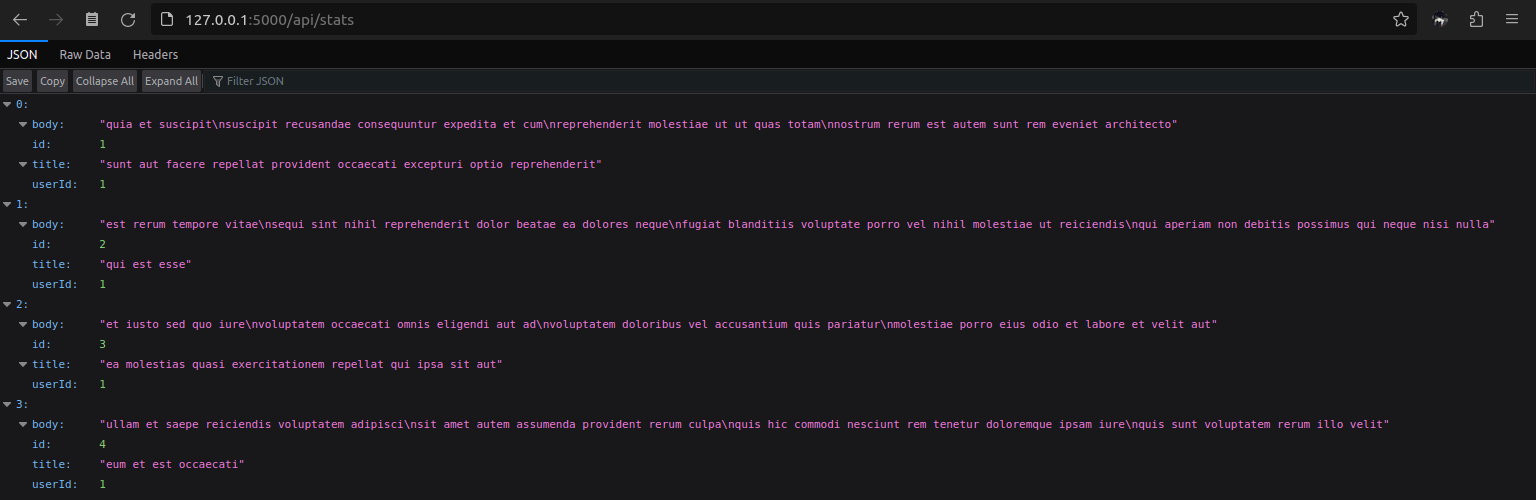
This code sets up a route /api/stats that returns a JSON response containing title and body data.
Start the API server by running the following command in the terminal:
python api.py
The API server will start running on http://localhost:5000/api/stats.
It should look like this:
Step 2: Setting up the Angular App
Now that we have our Python API ready, let’s set up the Angular app and integrate Kendo UI for Angular. Follow these steps:
Create a new Angular project using the Angular CLI:
ng new data-view-app
Navigate into the project directory:
cd data-view-app
Install Kendo UI for Angular modules: Check for more detailed instruction on manual Grid setup and manual Charts setup.
npm install --save @progress/kendo-angular-grid @progress/kendo-angular-charts
Step 3: Creating the Data View Components
In this step, we’ll create the components necessary to display and manage the data using Kendo UI for Angular.
Generate a new Angular component for the data view:
ng generate component data-view
Open the data-view.component.ts file and update it with the following code:
import { Component, OnInit } from '@angular/core';
import { HttpClient } from '@angular/common/http';
import { GridDataResult } from '@progress/kendo-angular-grid';
import { process } from '@progress/kendo-data-query';

@Component({
  selector: 'app-data-fetch',
  templateUrl: './data-view.component.html',
  styleUrls: ['./data-view.component.css']
})
export class DataFetchComponent implements OnInit {
  public gridData: GridDataResult = { data: [], total: 0 };
  public gridLoading = true;


  constructor(private http: HttpClient) { }

  ngOnInit() {
	this.fetchData();
  }

  fetchData() {
	const url = 'http://jsonplaceholder.typicode.com/posts';

	this.http.get<any[]>(url).subscribe(response => {
  	this.gridData = {
    	data: response,
    	total: response.length
  	};
  	this.gridLoading = false;
	}, error => {
  	console.error('Error fetching data:', error);
  	this.gridLoading = false;
	});
  }
}
Open the data-view.component.html file and add the following code:
<kendo-grid [data]="gridData" [loading]="gridLoading">
  <kendo-grid-column field="id" title="ID" ></kendo-grid-column>
  <kendo-grid-column field="title" title="Title" ></kendo-grid-column>
  <kendo-grid-column field="body" title="Body" ></kendo-grid-column>
</kendo-grid>
[Optional] Open the data-view.component.css file and add the following styles:
.grid-container {
  margin-bottom: 30px;
}

.chart-container {
  height: 400px;
}
Step 4: Add the Data View Component to the App
Open the app.component.html file and add the following code:
<app-data-view></app-data-view>
Then open up the app.module.ts file and the following code:
import { NgModule } from '@angular/core';
import { BrowserModule } from '@angular/platform-browser';
import { DataFetchComponent } from './data-view/data-view.component';
import { AppComponent } from './app.component';
import { HttpClientModule } from '@angular/common/http';
import { GridModule } from '@progress/kendo-angular-grid';
import { BrowserAnimationsModule } from '@angular/platform-browser/animations';
import 'hammerjs';


 // Import the HttpClientModule

@NgModule({
  declarations: [
	AppComponent,
	DataFetchComponent,
  ],
  imports: [
	BrowserModule,
	HttpClientModule,
	GridModule,
	BrowserAnimationsModule,

  ],
  providers: [],
  bootstrap: [AppComponent]
})
export class AppModule { }
Step 5: Running the Application
Start the Angular development server by running the following command in the terminal, within the project directory:
ng serve
- The Angular app will start running on http://localhost:4200.
- Open your web browser and navigate to http://localhost:4200 to see the data view with the grid.
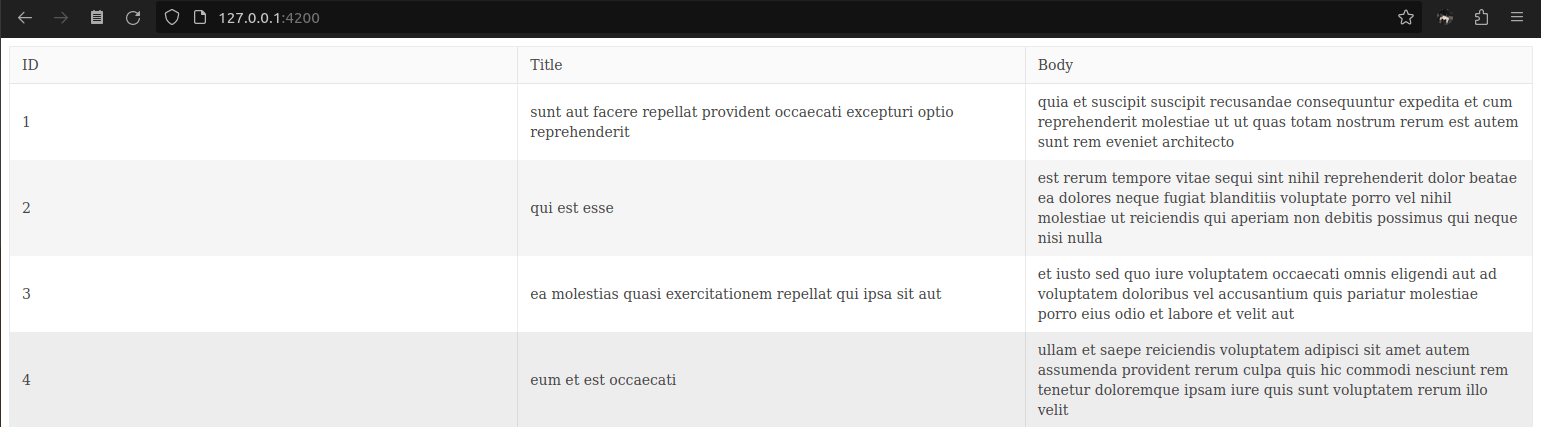
Congratulations! You have successfully built a data view using Kendo UI for Angular and consumed data from a Python-based stats API. The grid displays the title, and body as an example.
Feel free to customize the styling and expand the functionality based on your requirements. For example, a chart can very easily be added in this script, here’s how:
Adding a Chart
Firstly install the Kendo UI for Angular Charts package:
ng add @progress/kendo-angular-charts
Then add the following code to in the data-view.components.html file:
<kendo-chart>
  <kendo-chart-series>
  	<kendo-chart-series-item [data]="[1, 4, 5, 2, 1, 8]"> </kendo-chart-series-item>
  </kendo-chart-series>
</kendo-chart>
The code snippet you provided represents the usage of the <kendo-chart> component from Kendo UI for Angular to create a basic chart. The <kendo-chart> component is used
to render different types of charts, such as line charts, bar charts, pie charts and more.
Within the <kendo-chart> component, you define the series of data that will be displayed on the chart using the <kendo-chart-series> component. Each individual data series
is represented by the <kendo-chart-series-item> component.
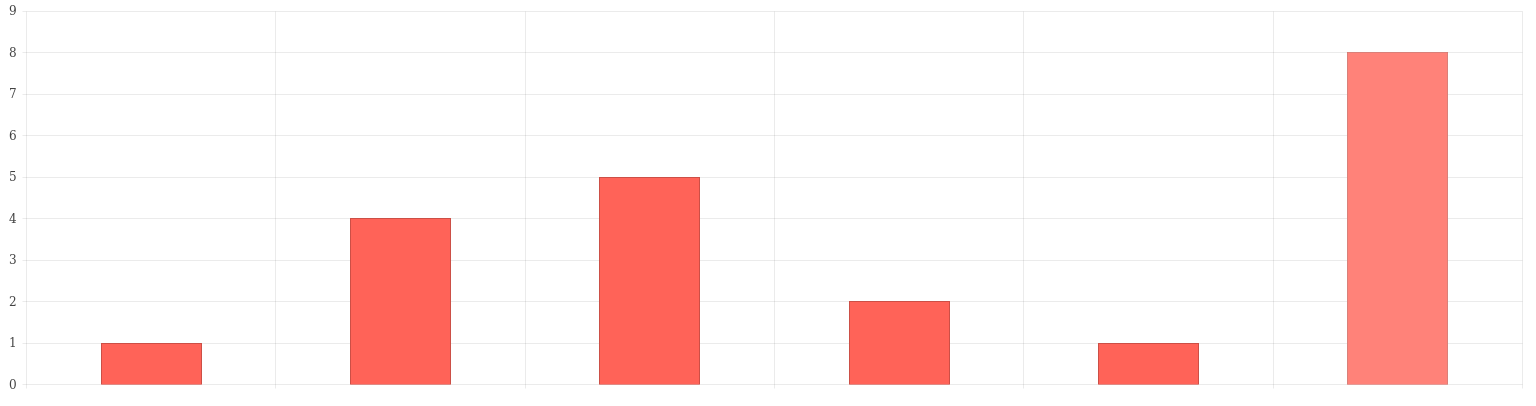
In the given code, we have a single data series represented by the <kendo-chart-series-item>. The [data] attribute is used to bind an array of values to the series item. In this
case, the array [1, 4, 5, 2, 1, 8] is provided as the data to be visualized on the chart.
Again, Start the Angular development server by running the following command in the terminal:
ng serve
Navigate to http://localhost:4200 to see the data view in chart:
Final Words
In this tutorial, we explored how to utilize Kendo UI for Angular to create a data view in a Python app. By following the steps outlined above, you learned how to set up the Python API, integrate Kendo UI for Angular into an Angular app, create components for data visualization, and retrieve data from the Python API.
Kendo UI for Angular provides advanced features for displaying and managing data, making it a valuable tool for Python developers. With grids, charts and other components, you can effectively present and manipulate data in your applications. Give Kendo UI for Angular a try today—it’s free to check out for 30 days!

Vyom Srivastava
Vyom Srivastava is an enthusiastic full-time coder and also writes at GeekyHumans. With more than four years of experience, he has worked on many technologies like Apache Jmeter, Google Puppeteer, Selenium, etc. He also has experience in web development and has created a bunch of websites as a freelancer.
Related Posts
Comments
All articles
Topics
Web Mobile DesktopDesktop
Design
Productivity
People

Latest Stories
in Your Inbox
Subscribe to be the first to get our expert-written articles and tutorials for developers!
All fields are required