How to Diagnose and Repair a Slow-Loading Website

What can you do to ensure your website’s most important pages always load as quickly as possible? Conducting regular speed tests and keeping your website well-maintained for performance will help a ton.
You or your client may have noticed that pages aren’t loading as quickly as they should be on your website. Or, worse, a visitor or customer has complained about the page speed issue to you.
So, where do you start in terms of diagnosing the problem?
Start by running a performance scan. There are various tools that will help you get to the root of the problem. But don’t stop there. Websites don’t just slow down once, get fixed and then run at optimum speeds going forward. They require ongoing testing and maintenance.
In this post, we’ll take a look at what these speed testing tools do and how you can use them to address immediate page loading issues. Then we’ll break down different things you can do to keep your website running at top speed.
How to Test the Loading Speed of Your Website
There are a number of free tools you can use to analyze the performance of your website. We’re going to use GTmetrix to test the speed of our desktop site and PageSpeed Insights to test the mobile counterpart.
Testing Your Desktop Website
GTmetrix is a good option if you’re looking to diagnose issues with a desktop website. Here’s what you’ll see in your performance report:
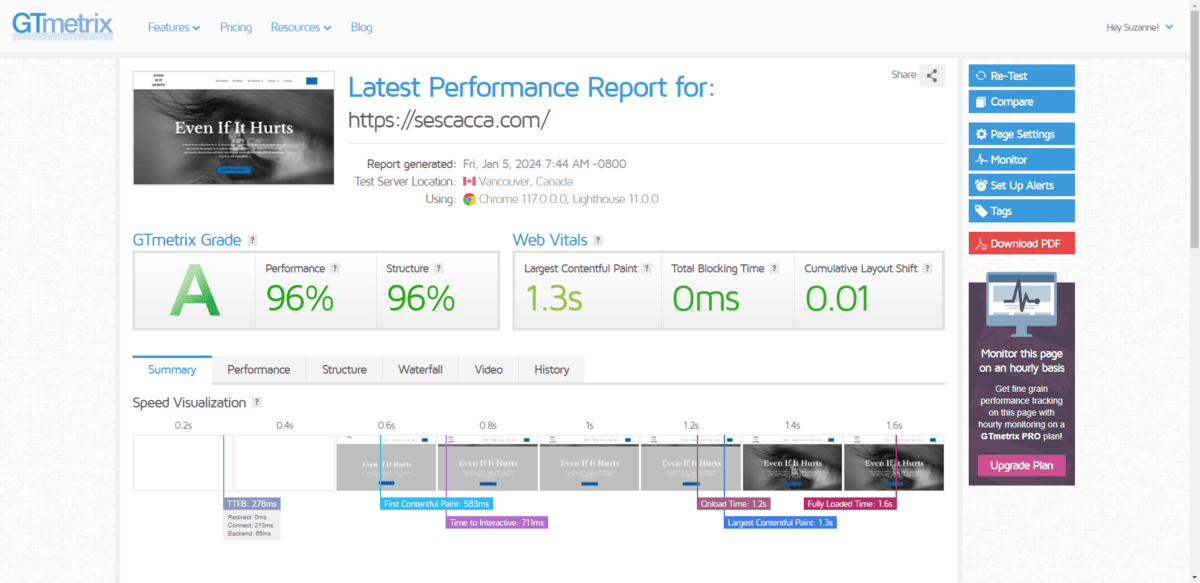
Summary tells and shows you how quickly your webpage loads. It also provides you with a Lighthouse-based performance score.
The tabs reveal even more details about your page’s performance.
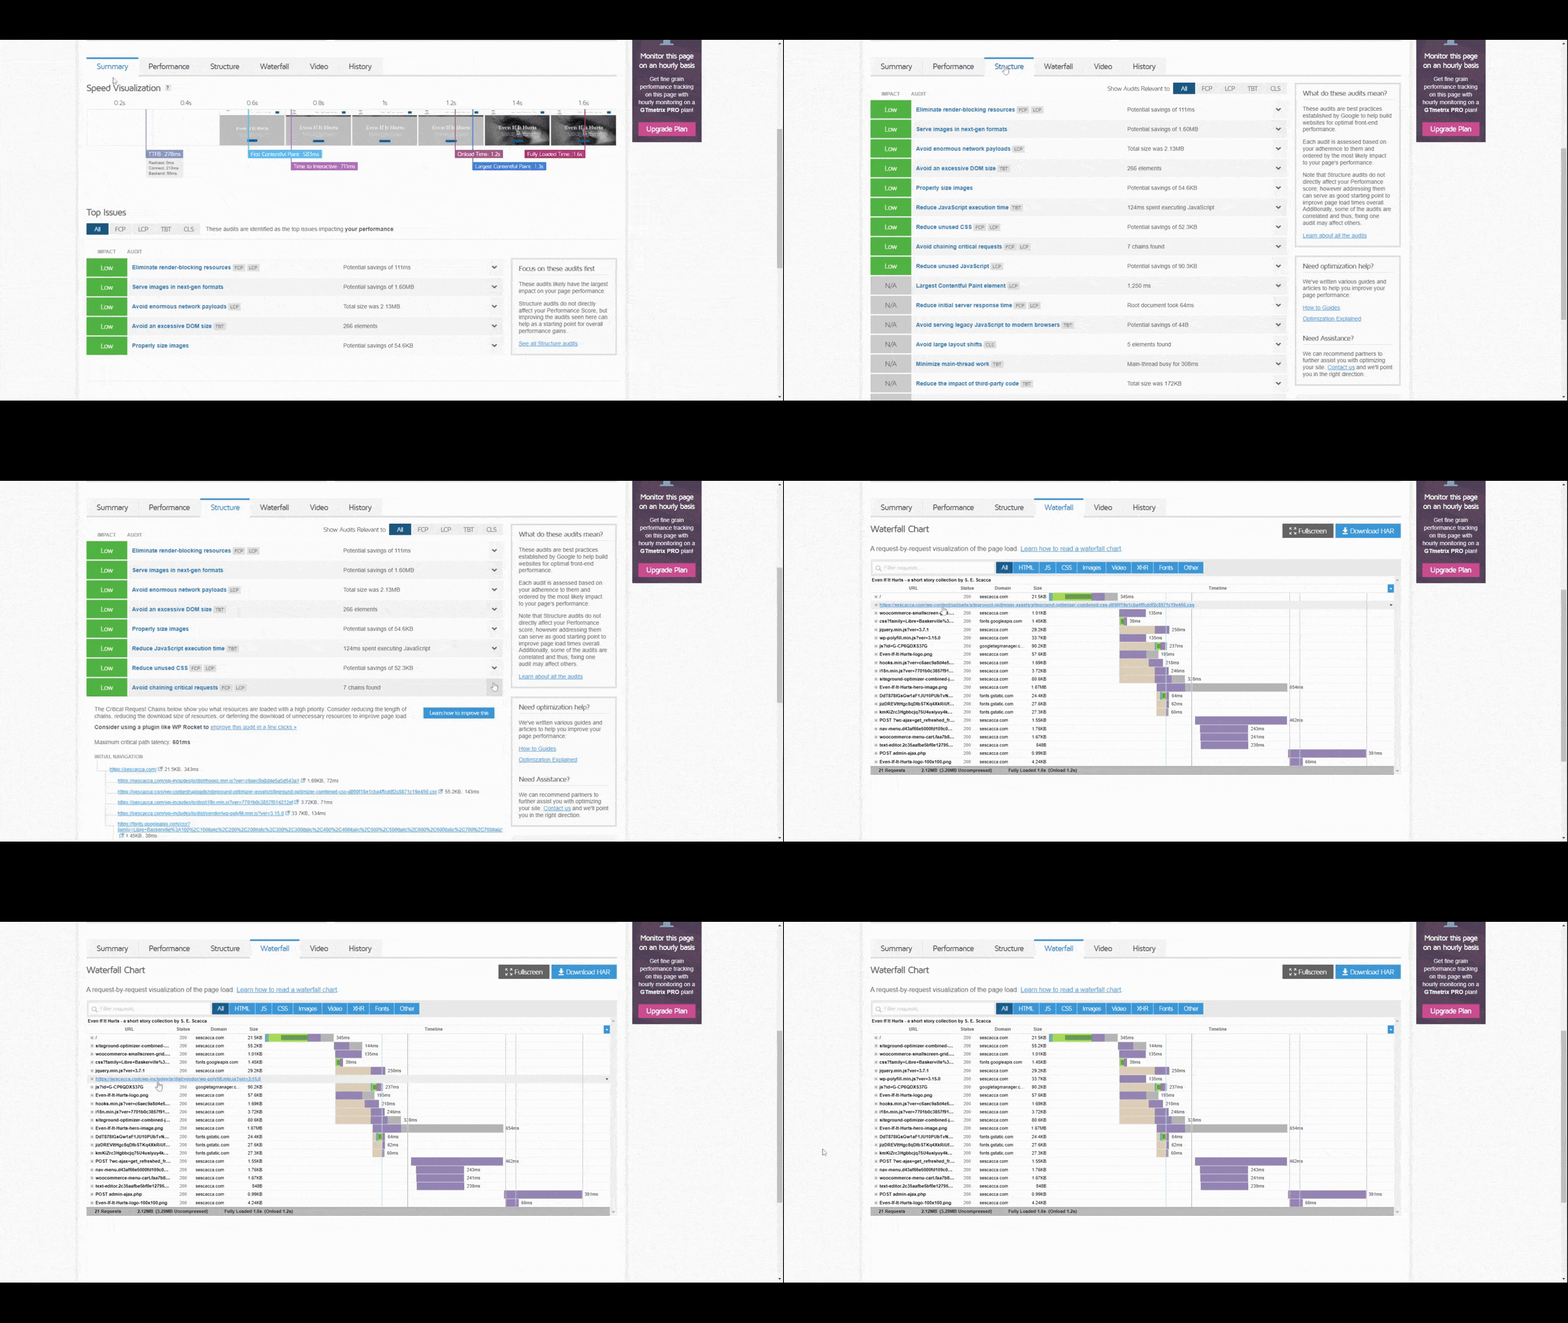
Performance provides a breakdown of loading metrics like first contentful paint, time to interactive, and speed index.
Structure provides tips on how to improve your speed. It focuses on things like:
- Image formats and sizes
- Render-blocking resources
- Unused CSS and JavaScript
- Third-party code
- Large queries
If your webpage is loading slowly right now, this is where you start. Go through the items that are marked as having an impact (low, medium or high) and make the suggested repairs.
Waterfall shows you a breakdown of every HTTP request the page has to process, the size of the request and how long it takes to retrieve each. Once the urgent items are fixed, this list is what you should work on next as it’ll point you to areas of the page that could benefit from greater optimization.
In addition to showing you which assets take the longest to load, this tab will show if there are unnecessary assets or scripts that are slowing things down. It will also come in handy if you’re looking to cut down the number of HTTP requests in general. If you have weighty features or functionality that are nice but not critical to have, you may want to remove them entirely.
Testing Your Mobile Website
Now, it’s important to provide users with a speedy website on desktop. However, if you’re at all concerned about how slow-loading pages affect your SEO (and they do), you’ll also want to run a speed test using PageSpeed Insights.
PageSpeed Insights puts the mobile experience first. So while you can analyze and troubleshoot issues on desktop with this tool, it’s the mobile speed results that you should pay close attention to as you won’t find them in GTmetrix or other speed test tools like Pingdom.
Here’s what the mobile page speed analysis looks like:
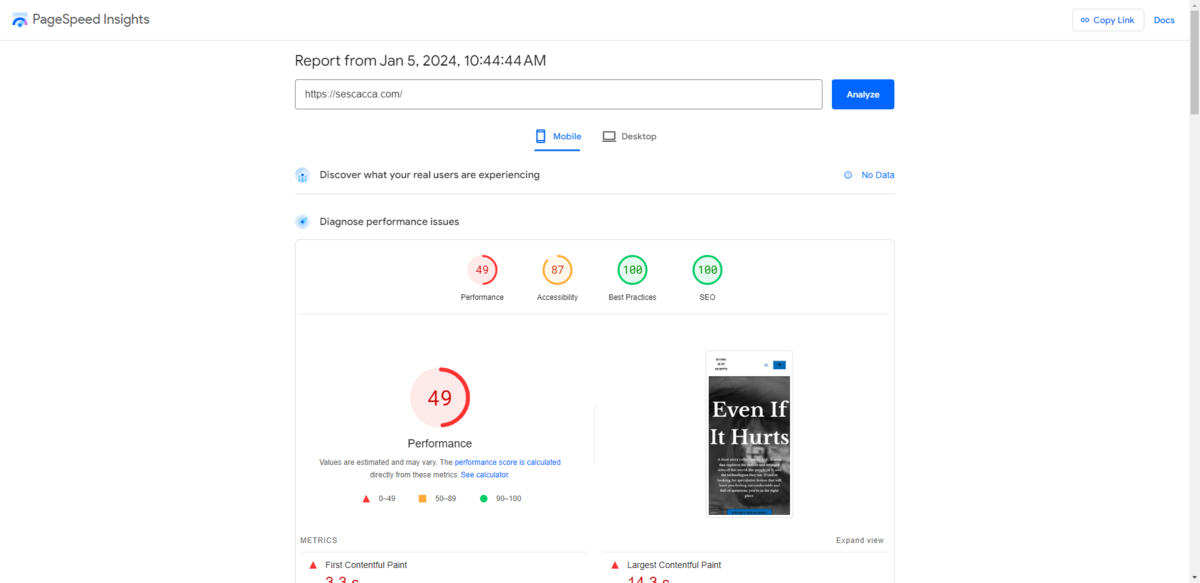
In addition to analyzing your desktop and mobile speeds, this tool troubleshoots issues with accessibility, search optimization, responsiveness, and more (all part of the page experience update).
PageSpeed Insights’s speed analysis is similar to what you’ll find under the Summary, Performance and Structure tabs in GTmetrix.
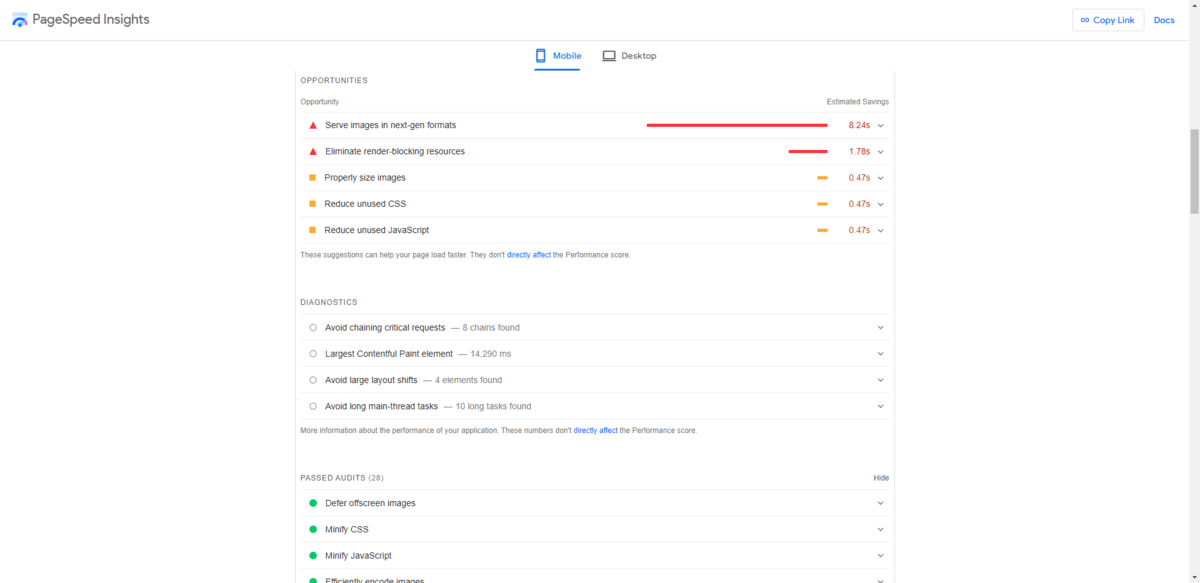
It’s not just the type of data that’s similar, the recommendations are similar as well. A lot of the feedback I received on the desktop site overlaps with the mobile one. It’s not completely identical, though, so it’s important to use both of these tools so that you are able to improve performance across all devices.
The only thing missing from this report compared to GTmetrix is the Waterfall. However, if you scroll back up to the timelapse images of your site and click on View Treemap, you’ll find the following visual and tabular analysis from Lighthouse:
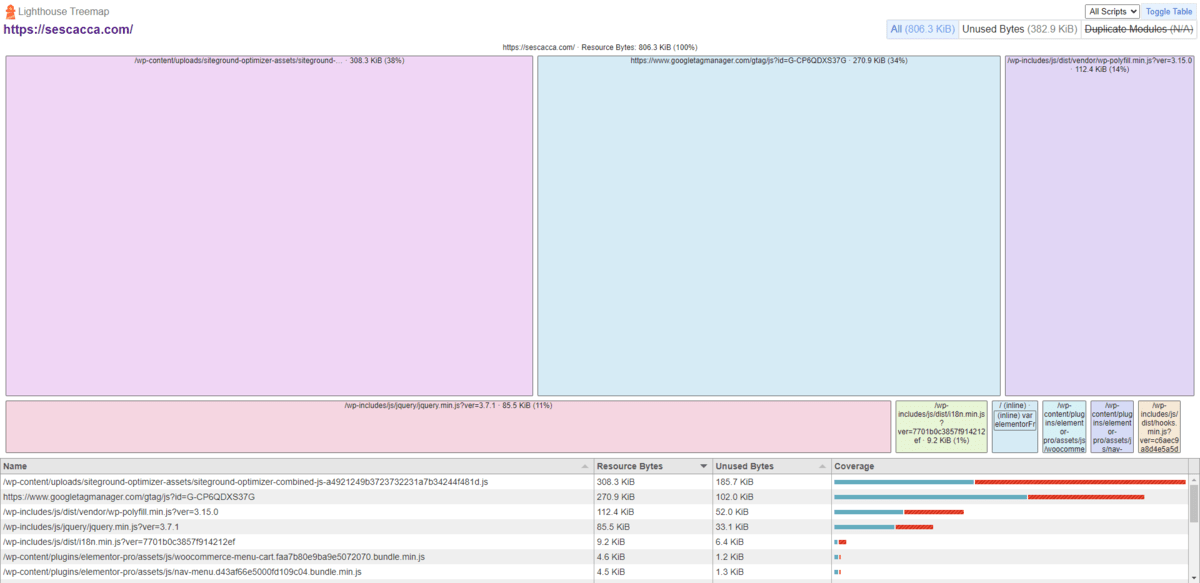
This page shows you what’s going on with the JavaScript bundles on the page. The visualization is helpful as it’ll help you quickly identify which of them are consuming the most resources.
This report also shows you which of these scripts have unused bytes. Unused bytes are problematic since they consume server resources that could be used by other assets on the page, making the page take longer to load than it has to. This can happen because there’s old and unused code in there. It can also happen when code that doesn’t need to load does so before components that are actually visible and active when the page first appears.
How to Keep Your Website Loading Fast
The list of recommendations you’ll find in GTmetrix and PageSpeed Insights are useful for troubleshooting speed issues you have right now. In addition to regularly testing your site speed and implementing the suggested fixes, you should make performance maintenance a routine habit as well.
If you’re looking for ways to keep your site loading fast, here’s a checklist you can use to zero in on common performance disruptors and fix them:
Media
- Save images in next-gen formats like WebP and AVIF whenever possible.
- Resize images for the designated space on the website.
- Compress images.
- Implement lazy loading.
- When uploading multiple videos to a page, host them externally on YouTube or Vimeo.
- Delete unused media files from your server.
- Use system fonts vs. uploading them to the server.
Code
- Use gzip compression.
- Minify all your files.
- Load stylesheets before everything else.
- Delete unused CSS and JavaScript.
- Remove render-blocking CSS and JavaScript.
- Implement asynchronous loading for your JavaScript files.
Features & Functionality
- Create a minimum viable product first.
- Design websites using a mobile-first mentality.
- Limit the number of HTTP requests on each page to 30.
- Disable endless scrolling.
- Minimize cookies.
- Avoid implementing redirects.
- Remove page redirects when traffic has slowed down or disappeared to the original page.
- Avoid using an excessive amount of page transitions, animations and interactions.
Third-Party Content
- Limit how many external elements and APIs you connect to your site.
- If displaying external ads, limit how many appear on each page.
- Alternatively, post ads as images with links.
- Use third-party integrations that are compatible with one another.
- Remove unused or unnecessary plugins or extensions.
- Replace slow extensions with comparable and faster solutions.
CMS
- Implement website caching.
- Use Expires headers so browsers know when to ditch the cached content.
- Keep your content management system software updated.
- Keep all third-party themes and extensions updated.
- Clean out your database a couple times a year.
Hosting
- Use web hosting built for your website type and anticipated traffic.
- Scale your server capacity as traffic grows.
- Prepare your server for high-volume traffic periods, like during the holidays.
- Implement server-side caching.
- Keep PHP updated.
- Use a CDN for high-traffic global websites.
- Set up real-time performance monitoring.
Wrap-up
No one wants to wait around for more than a few seconds for a webpage to load, especially if it’s the homepage of a website. Rather than wait for visitors to complain or, worse, for your bounce rate to skyrocket because of a slow-loading site, make performance a priority.
Schedule speed tests and repairs every few months to ensure you’re addressing the most critical issues. Then, at least once a year, perform an audit using the checklist above. Even if your site receives a passing grade on GTmetrix of PageSpeed Insights, you can always find ways to get your most important pages to load faster.

Suzanne Scacca
A former project manager and web design agency manager, Suzanne Scacca now writes about the changing landscape of design, development and software.

