Get Yourself and Your Clients Ready for the GA4 Switch

Starting on July 1, 2023, the Universal Analytics platform in Google Analytics will no longer be available. Here’s what you need to know about Google Analytics 4.
Over the last 10 years, Google has methodically made changes to its algorithm to account for what the “user experience” means to modern users.
First, there was the push for responsive design. Then came penalties for intrusive popups on mobile. And then Google encouraged everyone to move toward mobile-first design.
A couple years ago, the Google algorithm underwent a massive shift with the Page Experience Update. The mobile experience became top priority and websites were ranked according to four factors: performance, accessibility, SEO and design best practices.
In 2023, Google is about to make another big move. This one, however, is an update to the Google Analytics platform instead of its search algorithm. In this post, we’re going to take a look at Google Analytics 4 and its new user-centric, multi-channel approach to analysis.
What is Google Analytics 4?
Google Analytics 4 (GA4) is the next generation of Google Analytics. Going forward, we’ll refer to the previous iteration of the analytics platform as Universal Analytics (UA).
Goodbye, Universal Analytics
GA4 and UA exist on the same platform. You can see here that I currently have a GA4 and UA property for my freelance writing website:
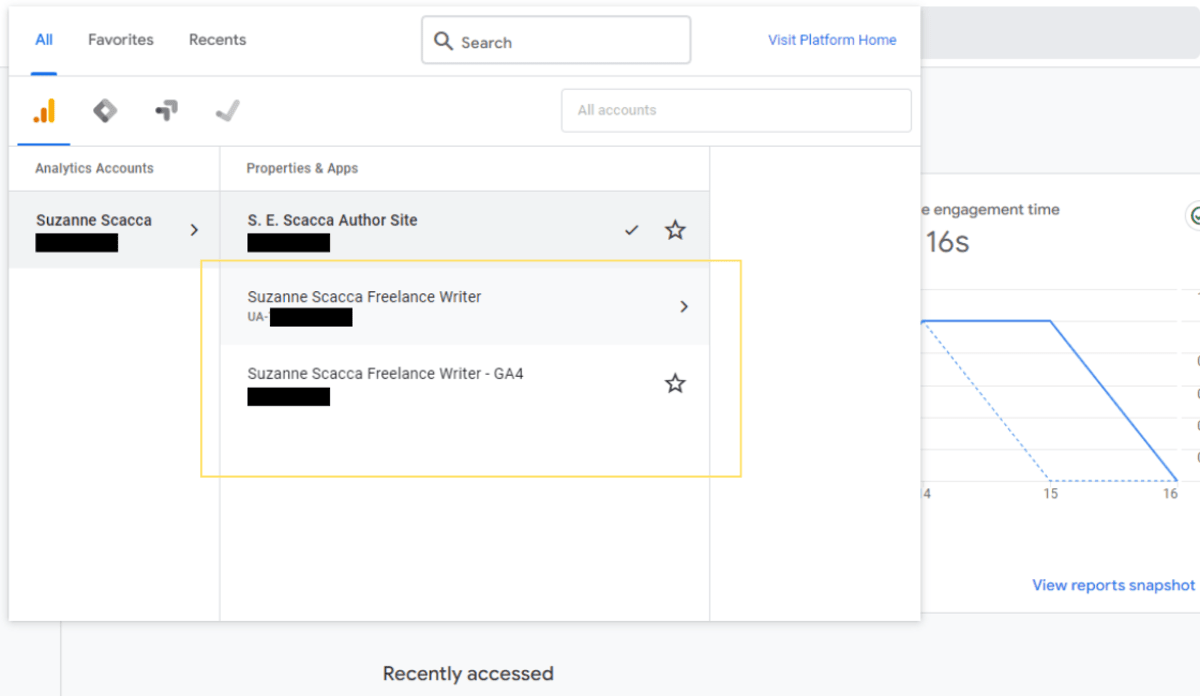
Both of these properties point to the same domain name. The only difference is that the one with the UA- account number takes me to the Universal Analytics dashboard:
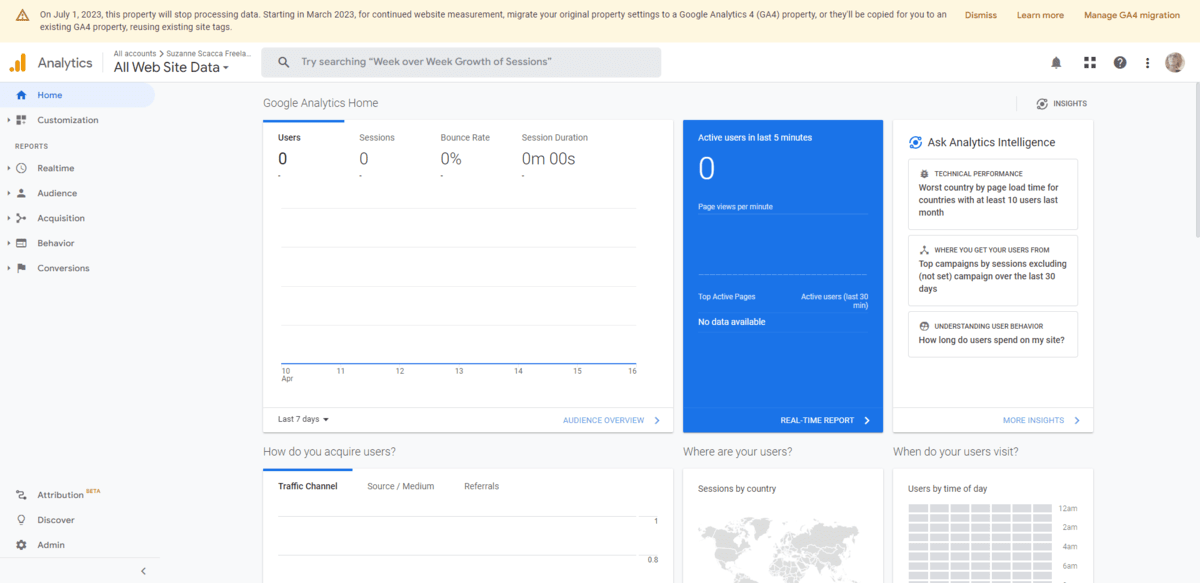
There’s no longer data in here because I removed the UA tracking tag from my website.
The other property in my list (which is an all numerical account number) takes me to the Google Analytics 4 dashboard:
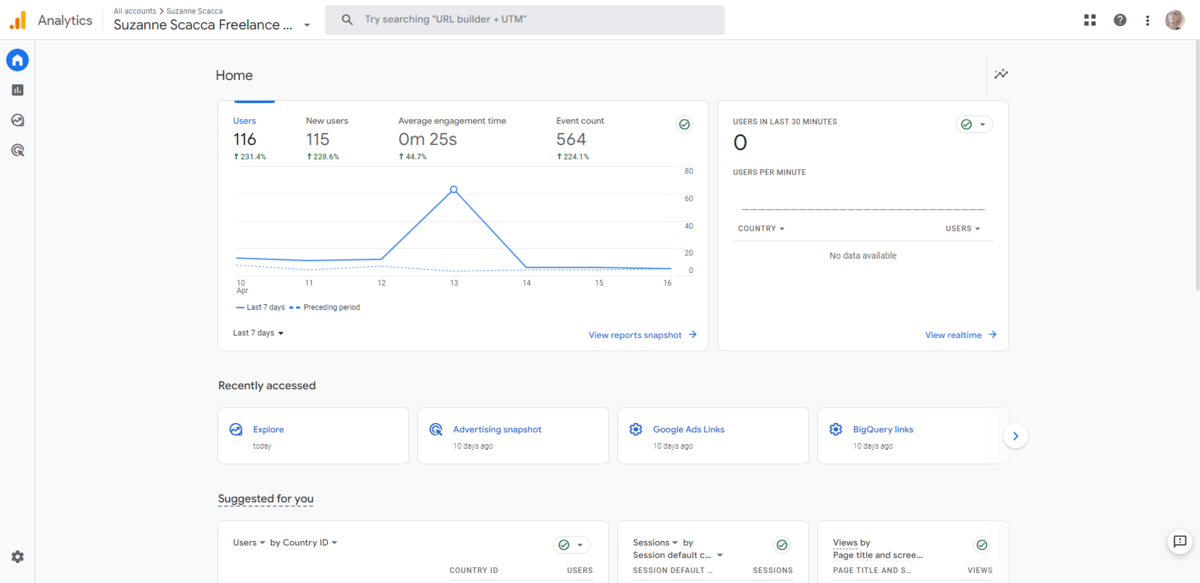
You can start using GA4 now. However, starting on July 1, 2023, you will no longer have a choice between the two analytics dashboards. GA4 will be the only one that works.
If you have a UA- tag still installed on your website or your clients’ sites, then the UA dashboard will continue to pull in data until June 30, 2023. I’d recommend removing that tag and replacing it with the GA4 one ASAP though. I’ll describe how to do that in the next section.
Hello, Google Analytics 4
On its face, the GA4 platform looks similar to the previous iteration. However, GA4 has reframed the way we analyze user data.
It’s no longer about evaluating sessions and counting how long a user stays on a page. It’s now about examining the customer journey and how users interact with your digital products.
So one of the biggest changes you’ll notice is that you can track your users on both your websites and mobile apps in GA4. Not as separate products either. Thanks to cookieless tracking, Google can identify and track users as they move from channel to channel—be it from your website to your mobile app and back again or from social media and other sites back to your own.
When you look at the history of Google’s algorithmic changes over the last decade, it makes sense why we’re here now. Google has steadily been pushing us towards paying attention to the user experience, especially as it pertains to mobile.
While the algorithm and ranking methodology had encouraged us to move in that direction, GA4 forces all of us to rethink the multi-channel user experience and how we design for it going forward.
How to Migrate to GA4
The process differs based on if you’re creating a new account or migrating from UA to GA4.
Creating a New Google Analytics Account
If you’re setting up a brand new Google Analytics account for yourself or one of your clients, you will automatically be given a GA4 account upon signing up. That’s simple enough.
However, something that may be different for you now is setting up your mobile apps alongside your websites. Go into the Admin area in GA4. Then go to your new Property and the section called Data Streams.
This is where you’ll see that you can add multiple “streams” (i.e., interconnected digital products) to the same account:
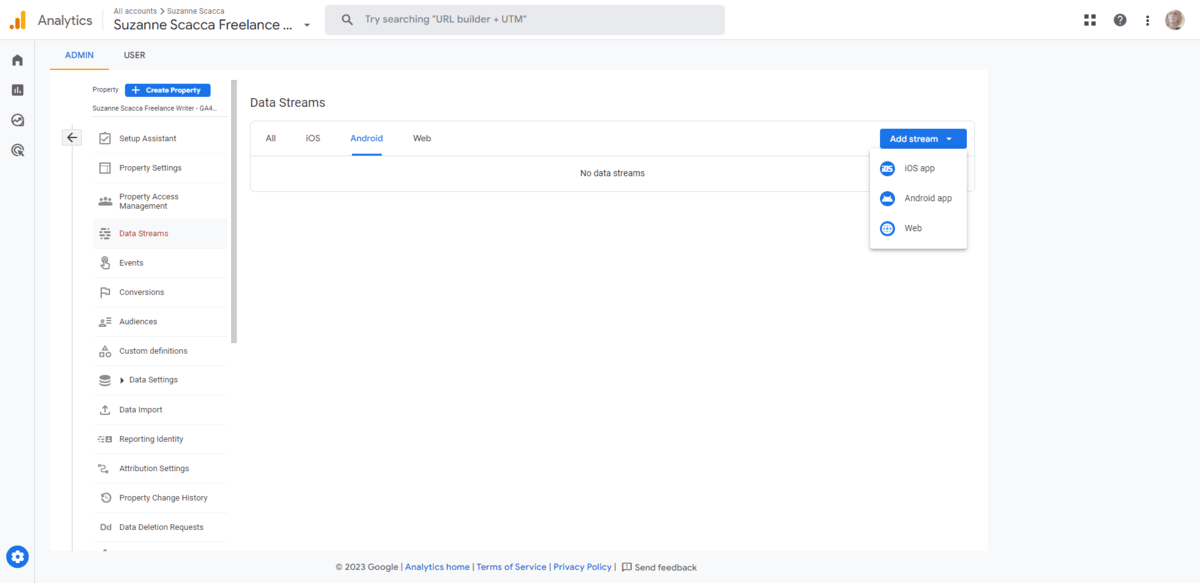
By adding your client’s connected products to the same account, you’ll be able to effectively track the same users as they move in and out of the various digital channels. Before, all you’d be able to do was review what happened during unique sessions on your website. This is a big upgrade for brands that have a website, apps and external channels that all work together.
Migrating from Universal Analytics
Now in terms of migrating an existing account from UA to GA4, there are three ways to kick the process off.
One option is to wait until July 1 and have Google do it for you. I wouldn’t recommend that.
Another option is to click the Manage GA4 migration button that appears in the notification bar at the top of UA right now. This will kick off the setup wizard.
The last option will take you to the same place as the second. If you dismissed the notification bar, you’ll find the GA4 Setup Assistant panel under Admin > Property.
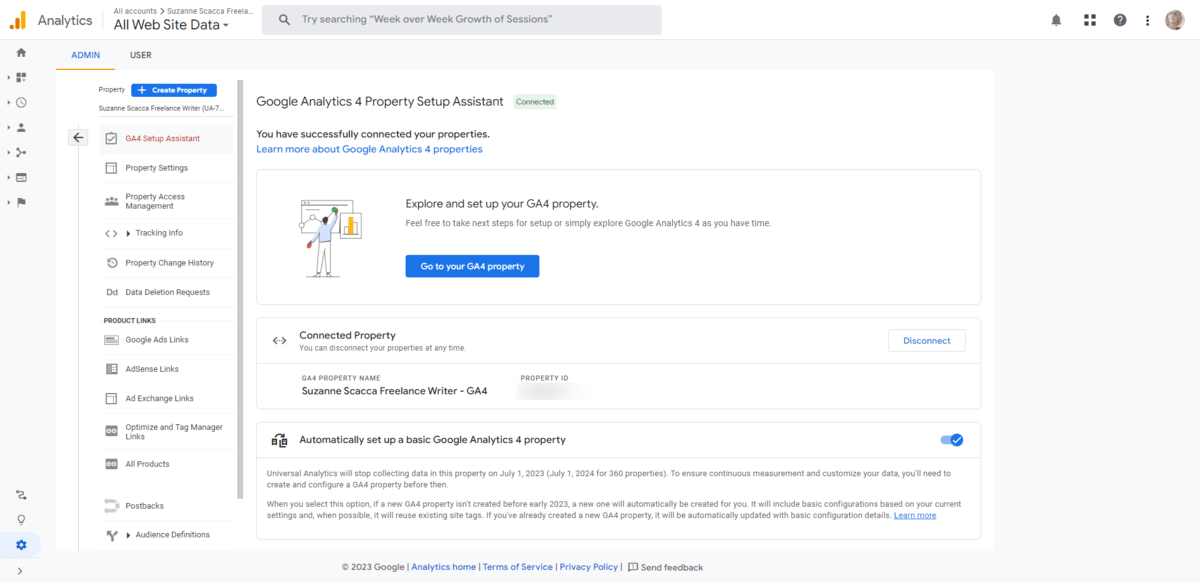
I’ve already migrated my account from UA to GA4, so my screen looks a bit different from yours. However, it’ll take just a few clicks to migrate your old data over to the new property.
You’ll then have to take the GA4 tracking tag you’re given and go into your content management system or mobile app and replace the old UA tag with it. It’ll take up to 24 hours for GA4 to start collecting data on your users.
What’s New in GA4 Reporting?
Now that we have the setup stuff out of the way, let’s talk about what’s different with GA4 in terms of data.
Customer Lifecycle Reporting
Universal Analytics had always been kind of clunky to use. While it provided a wealth of data on website sessions and activities that took place during them, you really had to know your way around the platform in order to find what you were looking for.
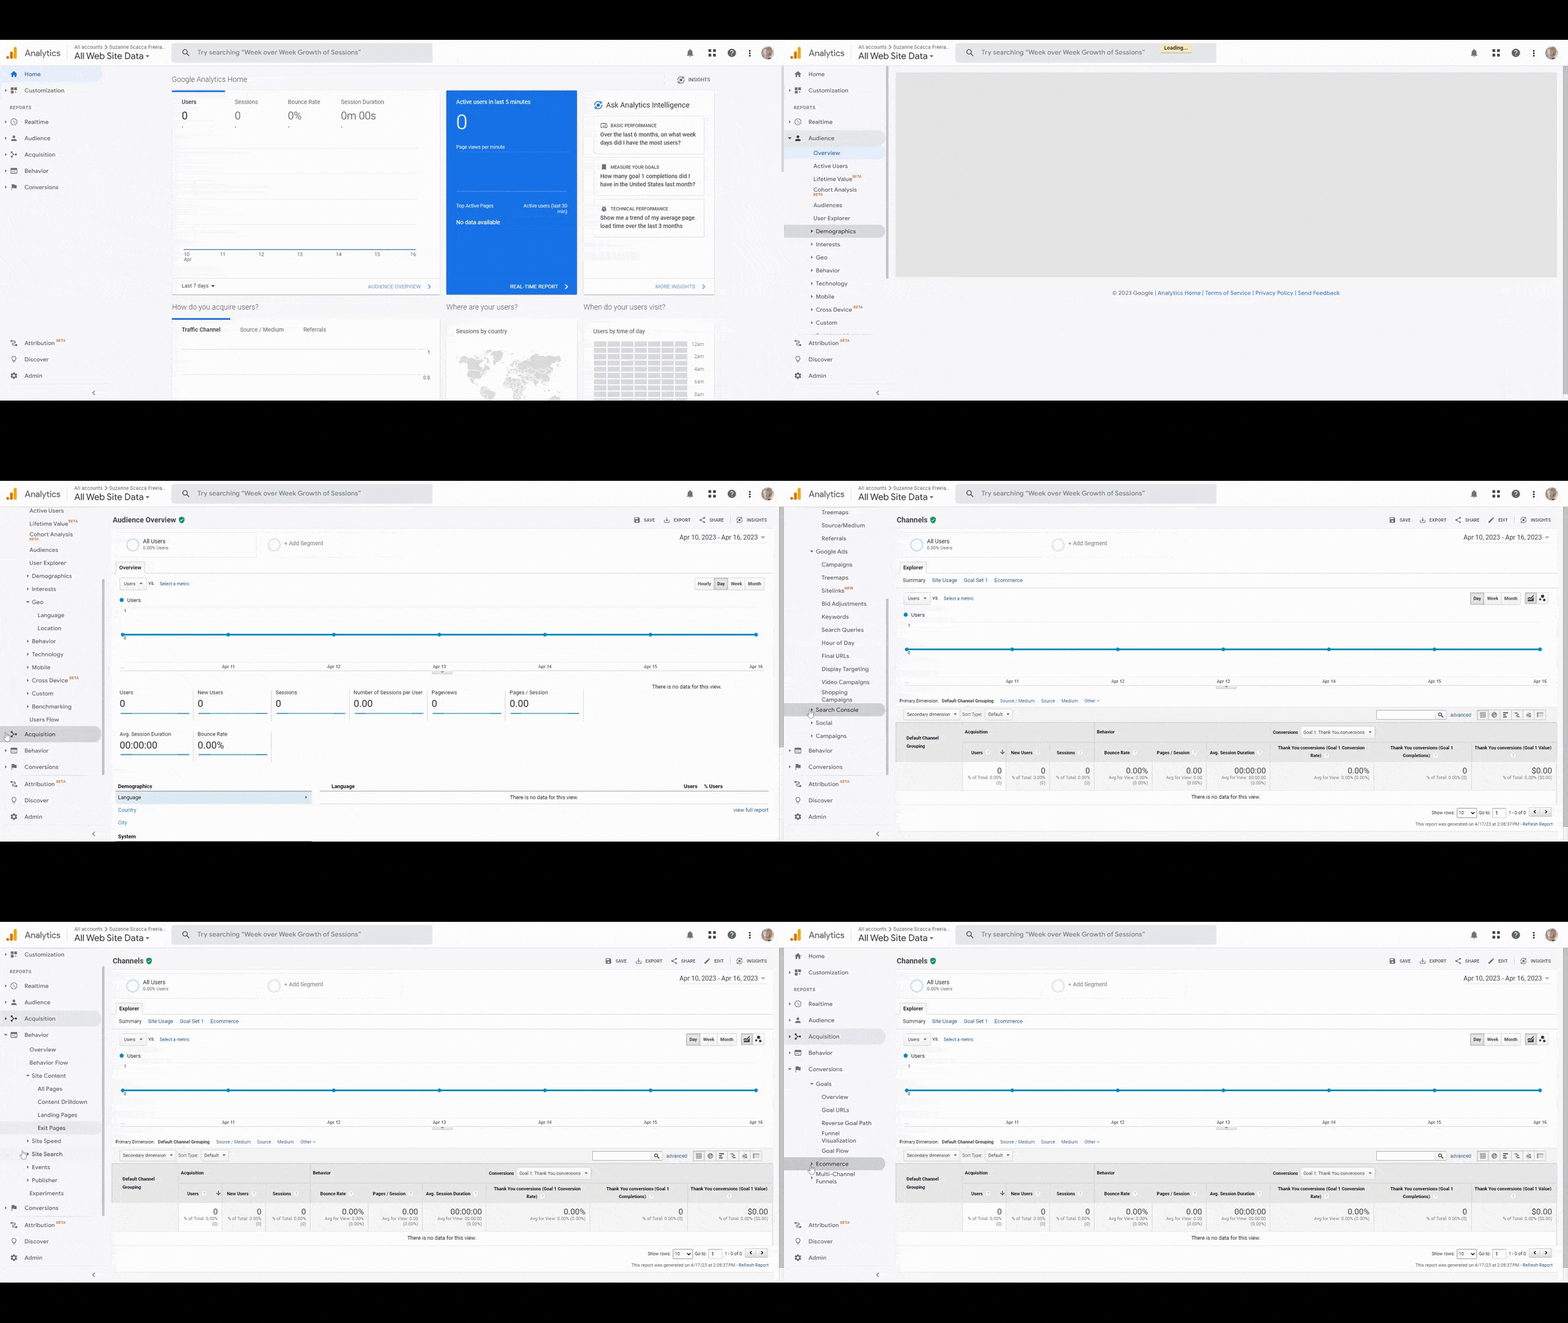
Within the four key sections—Audience, Acquisition, Behavior and Conversions—were dozens of other sections. The naming conventions weren’t always that intuitive. And there was sometimes overlap in which data was depicted.
Google Analytics 4 has done a better job of simplifying and organizing the reports areas:
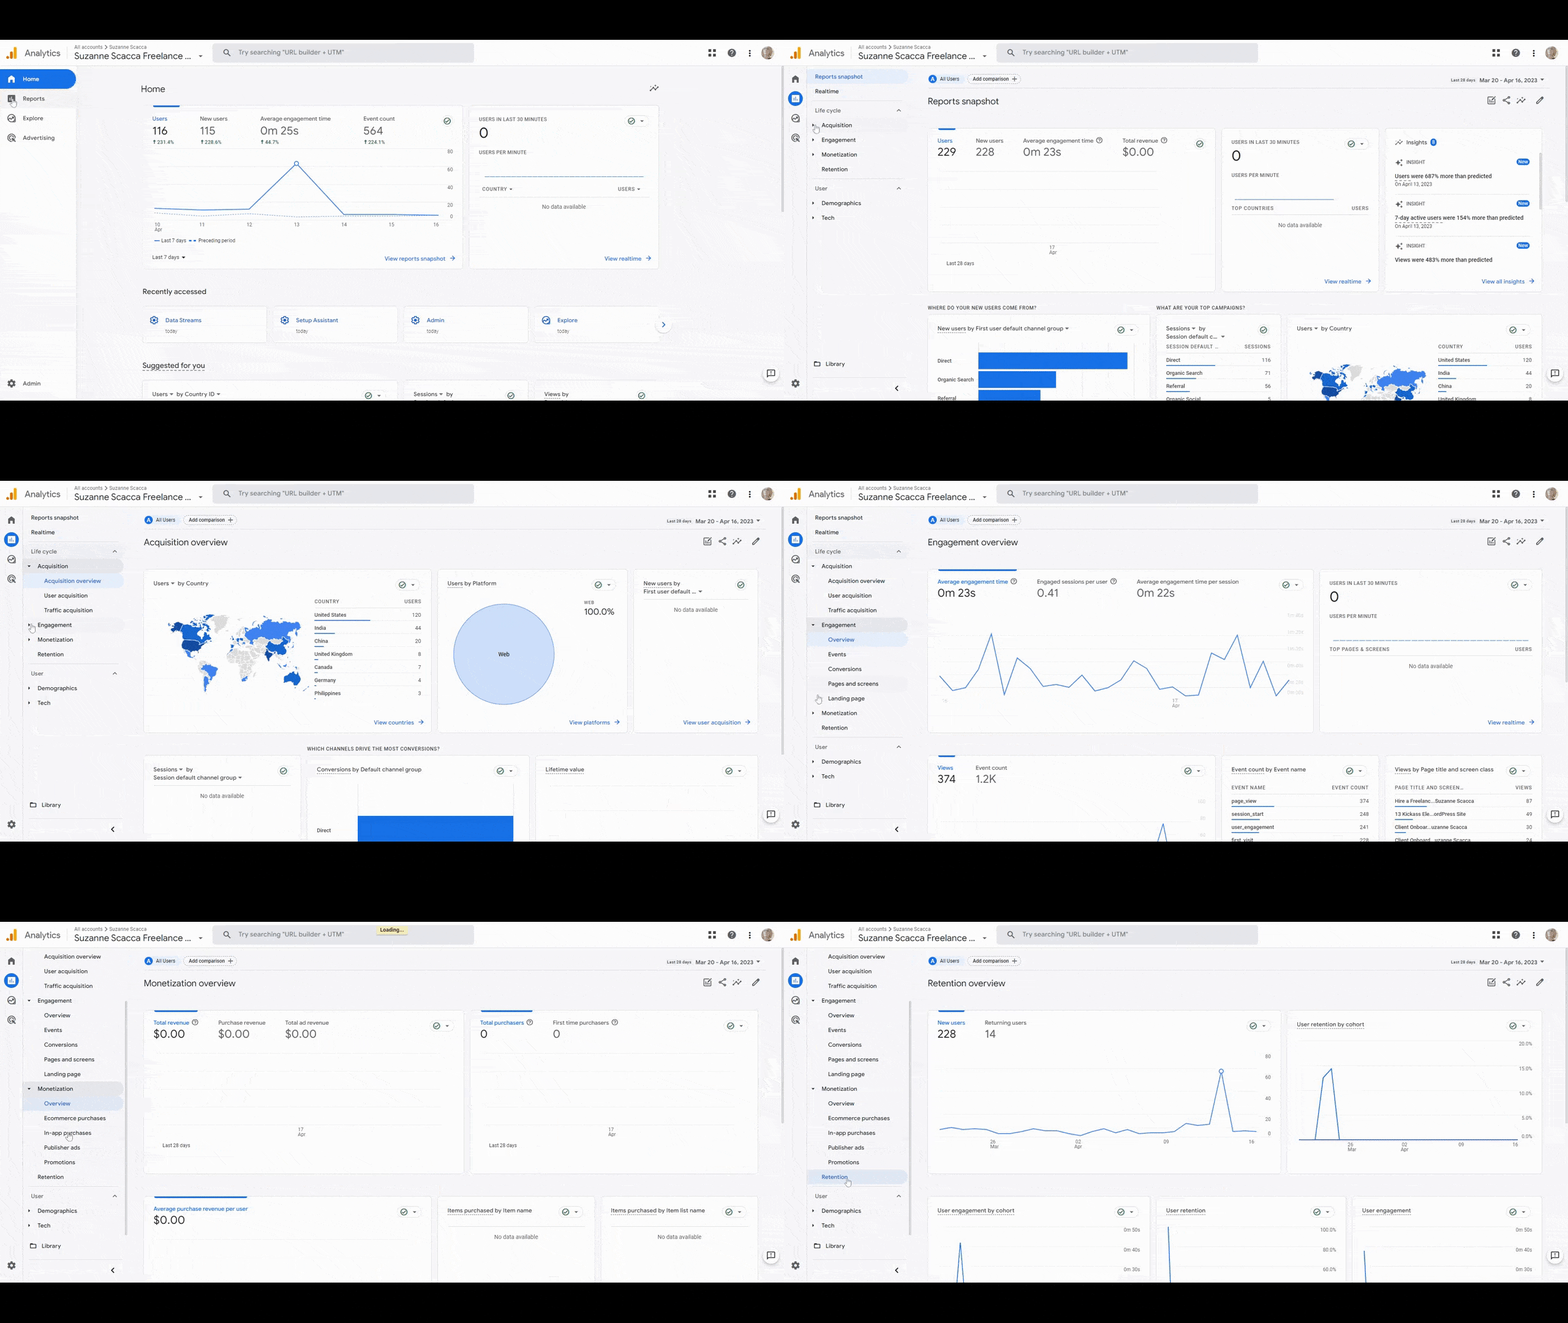
Although you can still look up user demographic info, it doesn’t take top billing anymore. In fact, Google has redesigned the reports dashboard so that it reflects the general lifecycle of the user journey:
- Stage 1: Acquisition
- Stage 2: Engagement
- Stage 3: Monetization
- Stage 4: Retention
What’s more, data has been truncated into a small handful of categories within each report.
It should be much easier for you to find what you’re looking for. The data should also give you a clearer idea of what’s going on with the user experience. While UA could generally tell you when something was off, GA4’s linear approach to laying out the user lifecycle will give you more meaningful data.
Custom Reports
While Google has simplified the reports dashboard, it hasn’t come at the expense of data availability.
Let’s say you’re looking at the User acquisition dashboard in GA4.
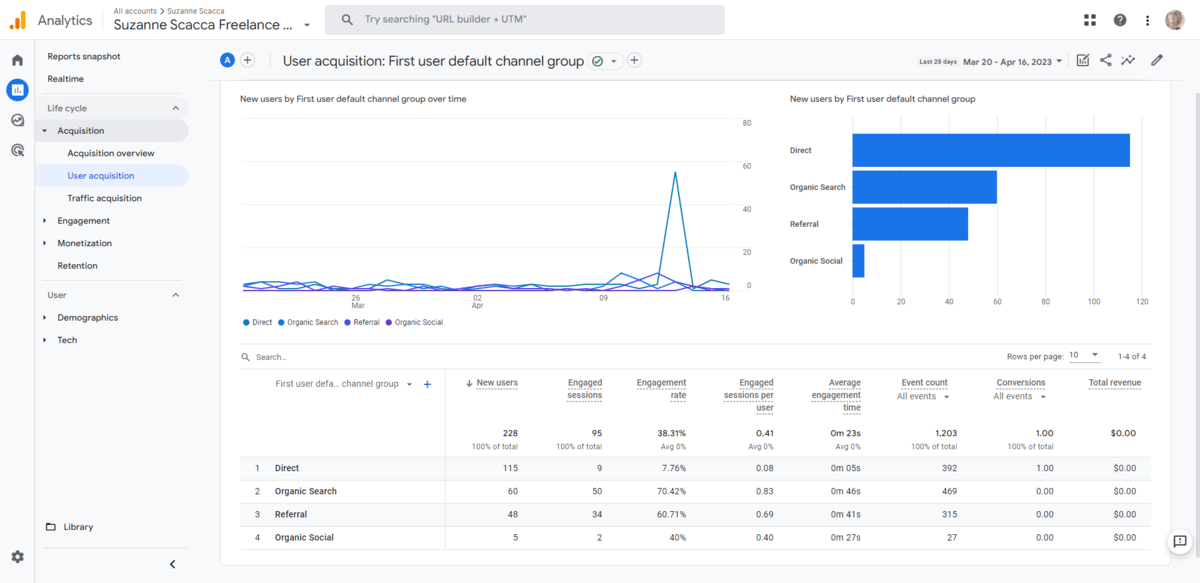
The overview is fine, but it seems a bit redundant. You don’t need a bar graph depicting the breakdown between acquisition channels if you can see the distribution in the table below.
To remove the default dashboard views and add more relevant data visualizations, click the pencil/edit icon in the top-right corner of the screen:
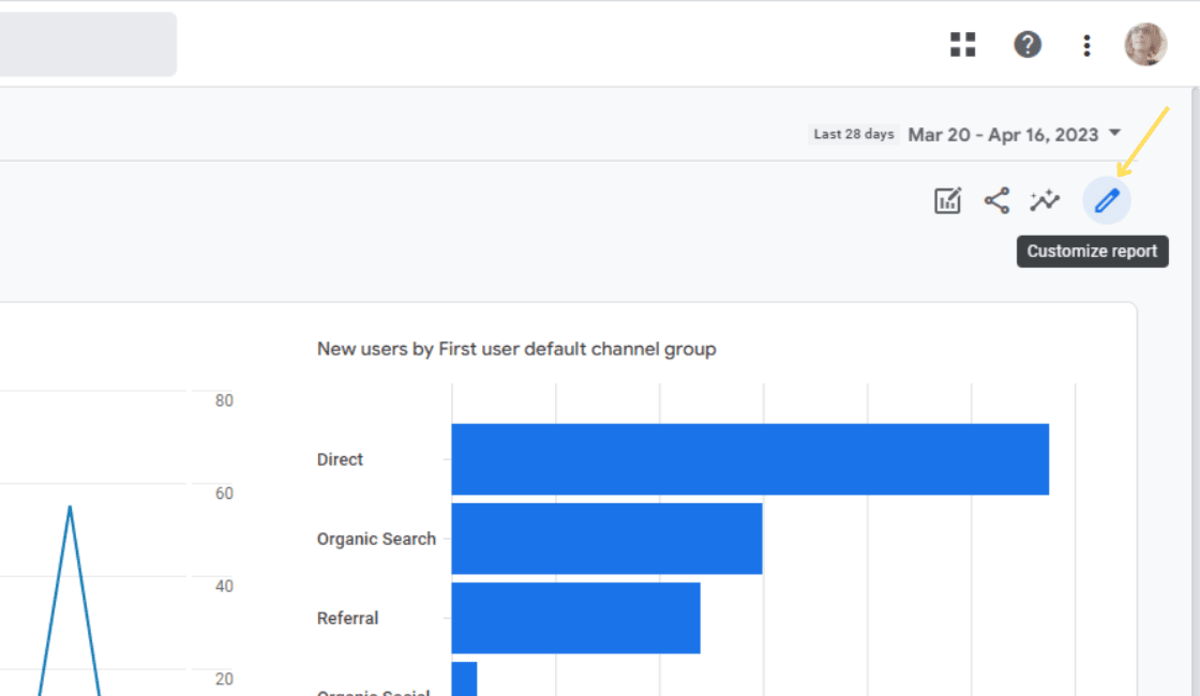
This will open the new reports customizer panel. Depending on which report you’re looking at, you’ll be able to:
- Reorder the data summary cards.
- Change the metrics and dimensions that are depicted in the dashboard.
- Modify the types of data visualizations you see.
- Filter the data based on different dimensions (e.g., user demographics, landing pages, devices, etc.).
- Edit existing summary cards.
- Delete summary cards.
- Create custom cards.
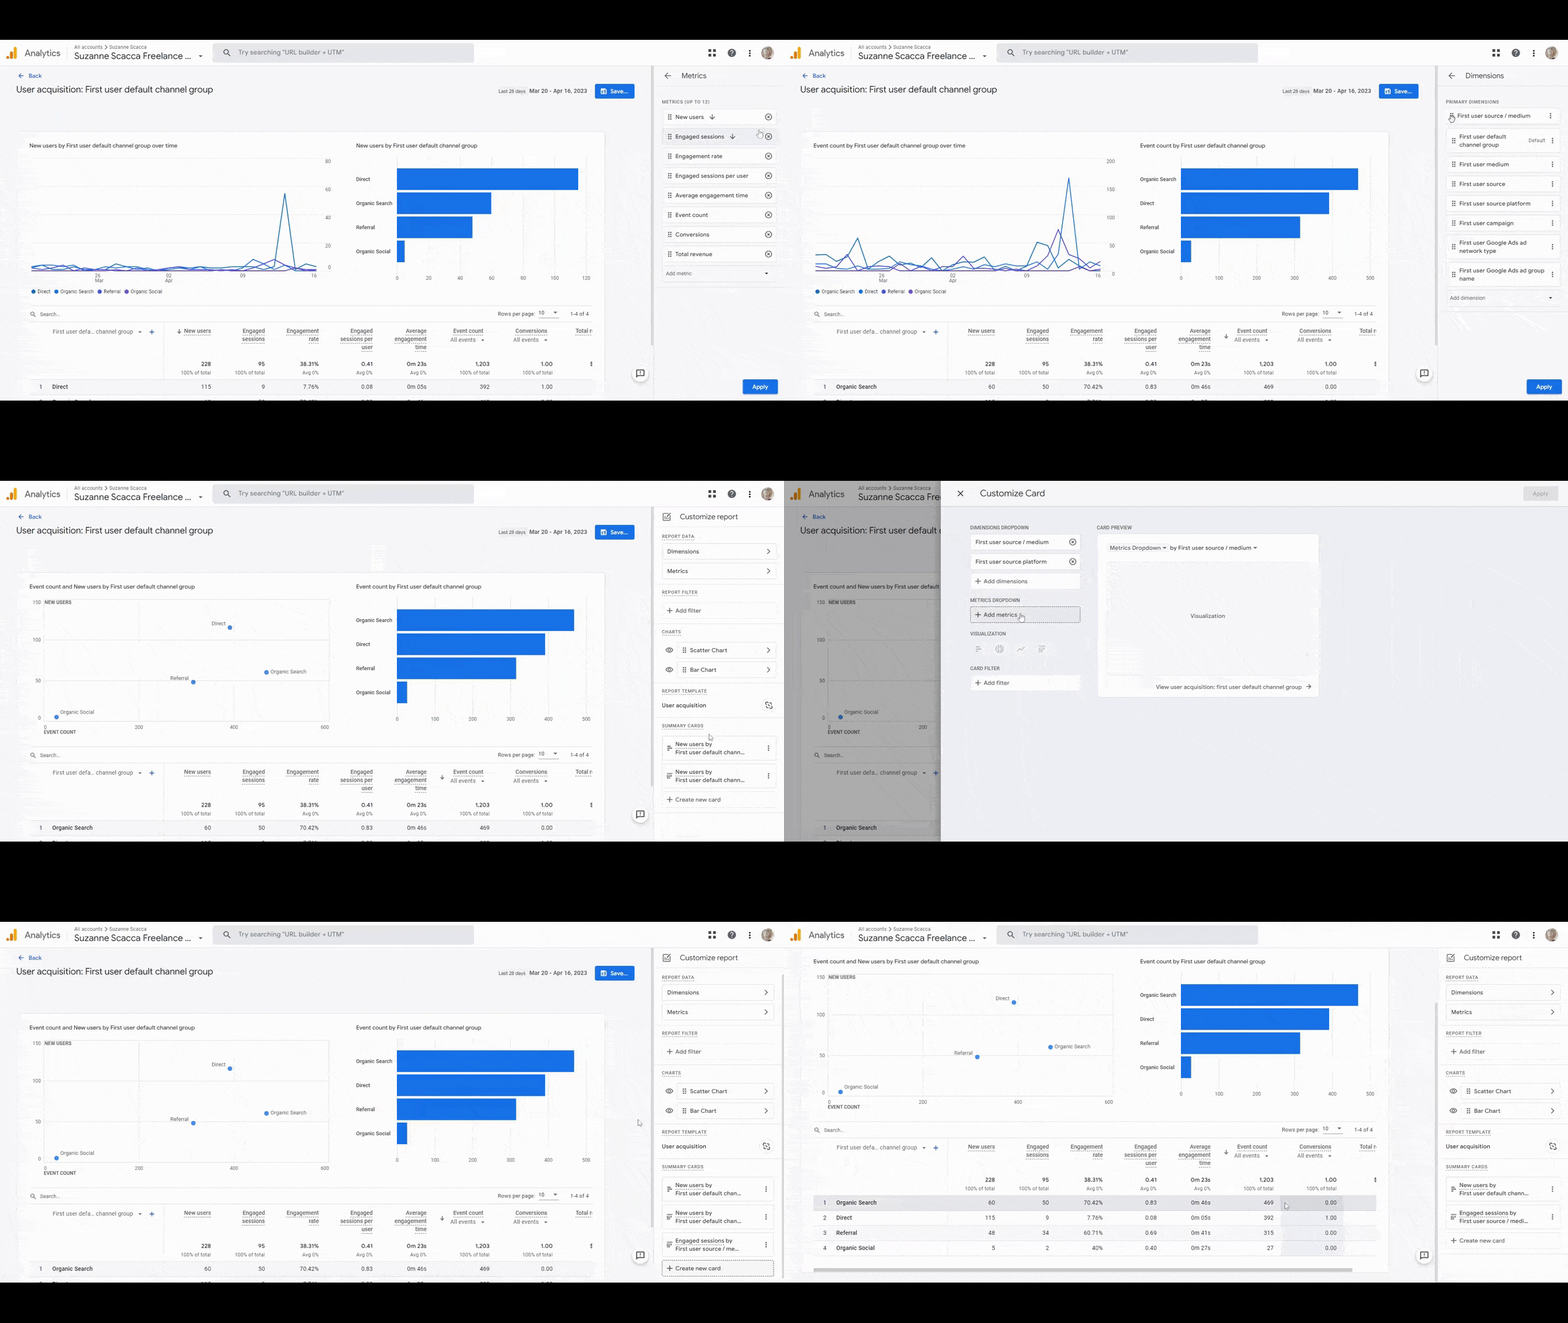
If what you find in GA4’s reports isn’t as relevant or useful as you’d like it to be, this new customizer tool gives you the chance to fix that.
Not only does this customization feature make it easier for you to analyze your product’s data, you can use it to make Google Analytics more client-friendly.
I can tell you that, from personal experience, most of my design clients hated the old UA. They found it confusing and/or overwhelming. So I had to spend a ton of time creating custom reports outside of GA to send to them. If you’ve found yourself doing the same, this new feature could be a huge time saver.
Events-Based Data
As you look through your GA4 reports, you’ll notice that there’s been a shift away from counting sessions and goals. Now the focus is on engagements, events and conversions.
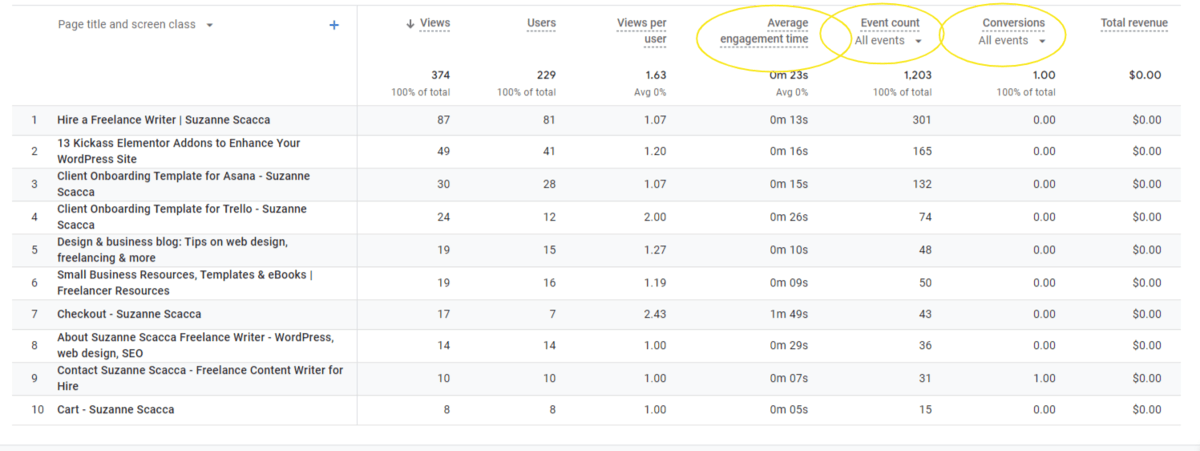
This move toward events-based data will enable you to focus on those critical touchpoints that users are supposed to hit as they go deeper into your digital product. If they’re not meeting those milestones and engaging with those touchpoints, then you know something is wrong with the user journey as you’ve designed it. (Or with the target users you’ve been attracting to your product.)
Out of the box, GA4 will configure events and conversions for you. However, if you want these reports to mean anything to you, you’ll have to customize them. You’ll find those customization panels under Admin > Property and either Events or Conversions.
Under Events, for instance, Google will give you basic engagement types like:
- Click
- Page_view
- Scroll
- Session_start
- View_search_results
If there are other things you want users to do, you can either modify the existing events or create your own.
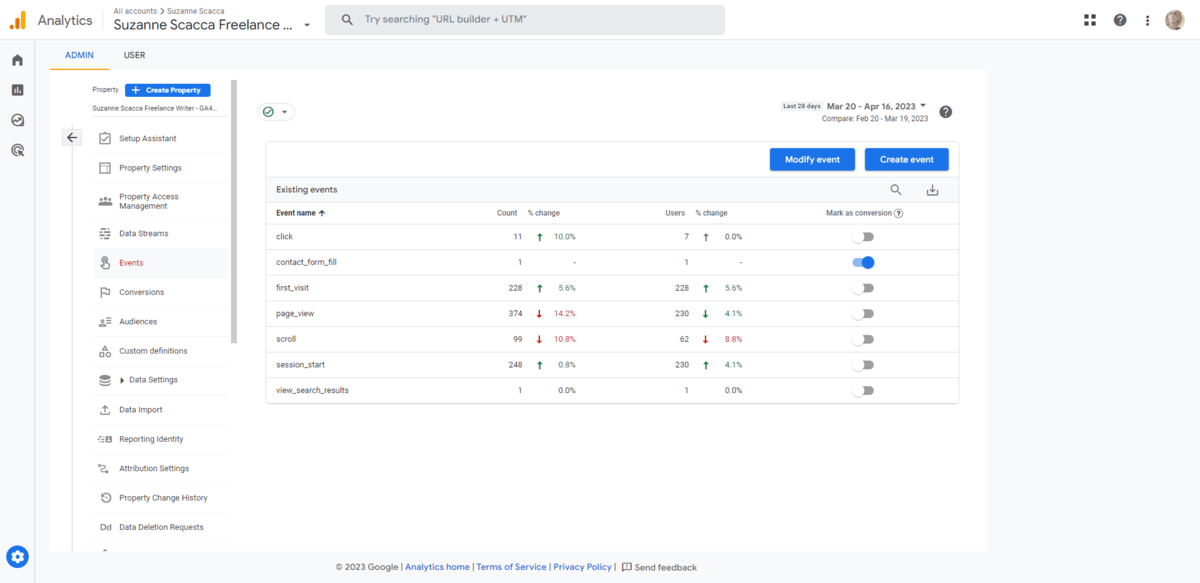
For example, I created two new events and conversions for my reports. Contact_form_fill tells me when someone has filled out the form on my Contact page. Add_to_cart lets me know when people drop a product into the cart, which I can then compare to my Checkout conversion rate data.
Once you’ve configured custom events and configures, you can use them to filter your data when looking at your reports. Just look for the Events and Conversions headers in your tables. Then click the dropdown arrow next to them to set the filter.
Anomaly & Trends Detection
While you’ll spend the bulk of your time in the Reports area of GA4, the Home section still has some value. Especially if you take advantage of the updated Insights feature which you’ll find at the bottom of the page.
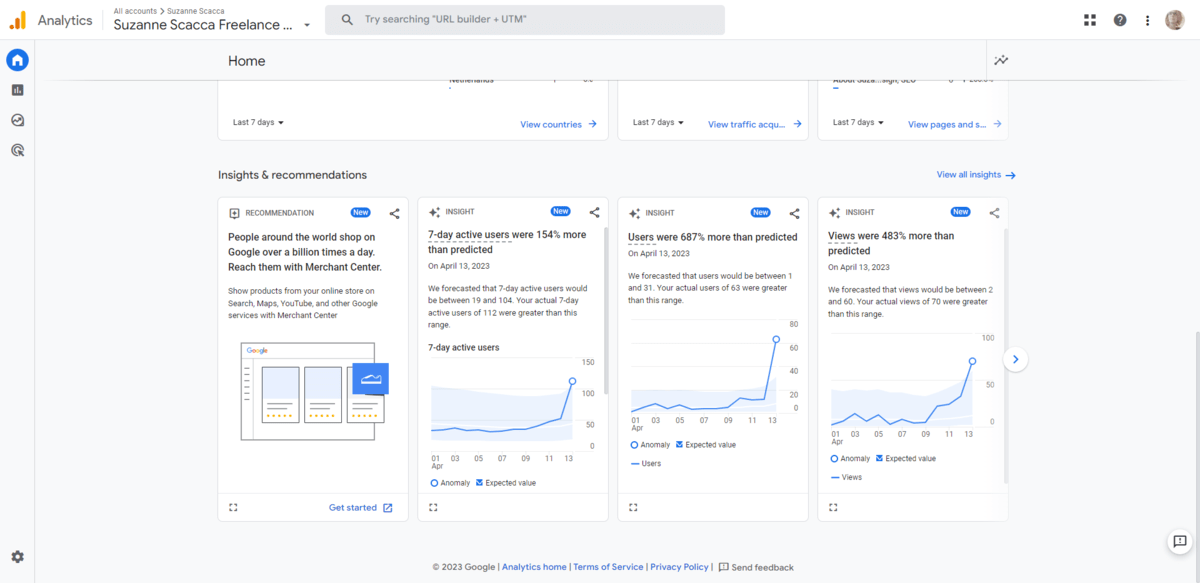
Once GA4 has had time to gather a substantial amount of data, you’ll start to see reports in this section. You’ll also see them in the top-right corner of some of your reports dashboards.
Some of these cards will contain recommendations on how to get more from your website and marketing. For the most part, though, you’ll find unique insights related to your website and/or app.
To see more, click on the View all insights button in the top-right corner of the section.
Because of the enhanced machine learning and predictive analysis approach to Google Analytics, you’re going to have access to useful data here. Google can tell you when anomalous activity takes place—like if your website experiences a traffic surge. It can also report on trends—like which day of the week you get the most visitors—which can help you better plan your content, run sales, things like that.
This tool also gives you the ability to create custom insights. Click the Create button in the top-right corner and you’ll be able to customize a premade insight or set up your own.
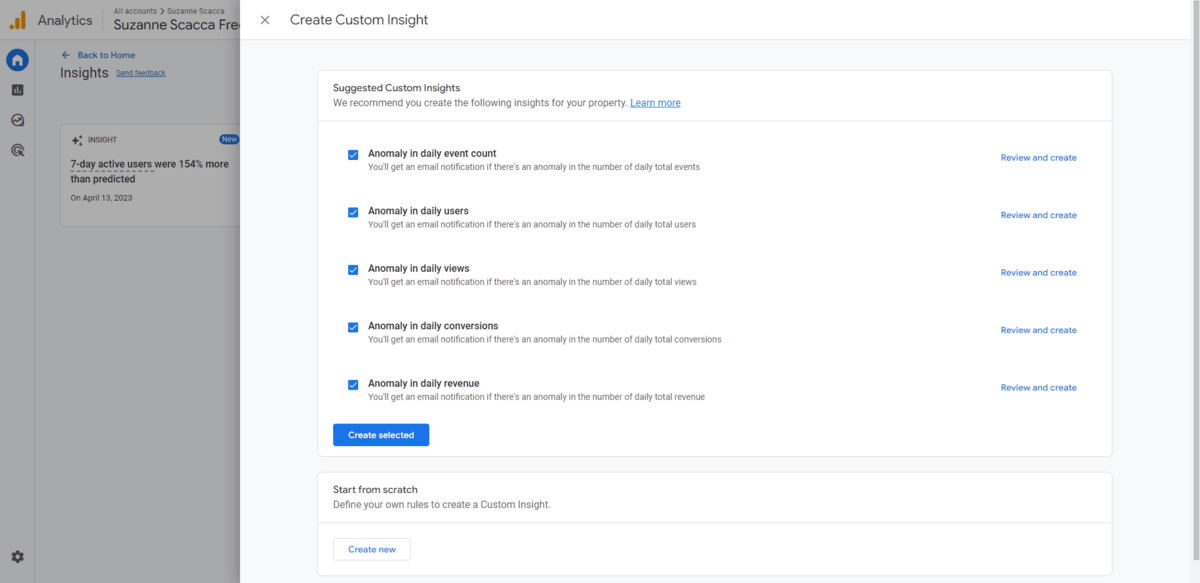
In addition to displaying these insight reports in GA4, you can enable daily, weekly or monthly email alerts so that you know when the anomalous activities or trends take place. This makes it easier and faster to know when something unexpected or noteworthy is going on with your product so you can react in a timely fashion.
Wrap-up
There are other big changes that come with switching over to Google Analytics 4. For instance, the old user funnel pathway tool can now be found under Explore. You can do much more than just visualize user journeys there, too.
Another big change is that GA4 has brought Google Ads campaign data into the dashboard under Advertising. You can also sync GA4 with BigQuery if you want a faster way to analyze vast amounts of events data.
But if we’re talking about the core functionality of Google Analytics, the changes noted above are the most important ones to focus on. Google’s algorithm has slowly been reconfigured around the modern user experience. Google has now brought its analytics tool up to speed.
If you haven’t started to move your web design process toward an omnichannel and UX focus, now is the time to do it. That’s what the search engines will be evaluating your digital products on and that’s the lens through which you’ll view your products’ metrics.

Suzanne Scacca
A former project manager and web design agency manager, Suzanne Scacca now writes about the changing landscape of design, development and software.

